By Our Staff
India’s media and entertainment industry is expected to reach INR 4,30,401Cr by 2026 at 8.8% CAGR. These figures come from PwC’s Global Entertainment & Media Outlook 2022-2026, the 23rd annual analysis and forecast of M&E spending by consumers and advertisers across 52 territories.
Said Rajib Basu, Partner & Leader – Entertainment & Media, PwC India: ”The Indian Media and Entertainment outlook for the next few years is quite unique. There is an exciting pace of growth of digital media and advertising led by the deeper penetration of internet and mobile devices in our market. At the same time, traditional media will hold their steady growth rate over the next few years. We shall see a very different profile of media and entertainment related businesses and revenue models emerging in the digital space once we have the rollout of 5G.”
Key findings for India in this year’s Outlook include:
OTT Video: Total OTT revenue more than doubled in 2020, partly driven by the absence of public entertainment and additional time at home. This trend continued in 2021, with revenue nearly doubling again. While growth rates will slow, the market will still expand at an impressive 14.1% CAGR to reach INR 21,032Cr in 2026. It is subscription services that are driving this rapid growth, accounting for 90.5% of revenue in 2021 and set to account for 95% in 2026.
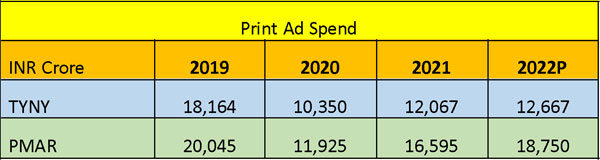
Newspapers & consumer magazines: India will see an increase in total newspaper revenue at a 2.7% CAGR from INR 26,378Cr in 2021 to INR 29,945Cr in 2026. India, which will leapfrog both France and the UK to become the fifth-biggest newspaper market by 2026, will also be the only country to grow total newspaper print revenue consistently across the five-year forecast period. India will also be the only country in the world to grow daily print newspaper copy sales (by volume) during the forecast period. The increase at a 1.3% CAGR – to an average of 139mn daily average print newspaper sales in 2026, one-third of the global daily total – will mean that India will overtake China as the biggest world market for print edition readership in 2025.
Out-Of-Home Advertising: India’s out-of-home (OOH) advertising market is demonstrating one of the strongest comebacks globally and is predicted to grow at 12.57% CAGR to reach INR 5,562Cr in 2026. Total OOH revenue recovered by 63.4% in 2021 over the 2020 levels which was one of the steepest downturns of any market and the biggest fall in revenue among the world’s major economies. In 2021 total OOH revenue was up to INR 3,076Cr. The momentum of this rebound will carry over into 2022, and by year-end the market will be at the value INR 4,084Cr.
Video games & esports: India’s total video games and esports revenue was INR 16,200Cr in 2021, and is forecasted to reach INR 37,535Cr by 2026, increasing at a 18.3% CAGR. While still a fairly small market for the country’s size and population, India is the third fastest-growing video games market in the world, after Turkey and Pakistan. India’s video games market is predominantly geared towards social/casual gaming. With revenue of INR 13,244Cr, social/casual gaming made up 83.9% of India’s total video games and esports revenue in 2021. Expanding at a 20.6% CAGR, social/casual gaming revenue is expected to reach INR 34,581Cr by 2026. A big enabler of this segment will be the emergence of 5G technology in the market.
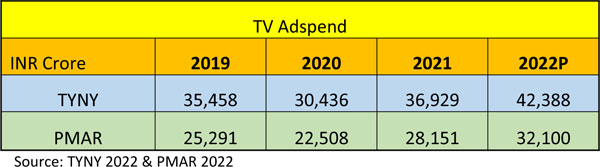
TV advertising: After several years of rapid expansion, India’s TV advertising market was hit by the Covid-19 recession in 2020, causing a -10.8% decline over the 2019 levels. This proved to be a temporary setback. With the country’s return to economic growth in 2021, this segment grew by 16.9% to INR 32,374Cr. The market will expand further at a 6.3% CAGR to reach INR 43,410Cr by 2026. At this time, India will be the fifth-largest TV advertising market globally, after the US, Japan, China and the UK.
Cinema: India is the third-biggest market globally in terms of admissions after China and the US in 2021 and is set to grow at the highest growth rate amongst all the segments at a staggering 38.3% CAGR in the forecast period to reach INR 16,198Cr by 2026. In 2021 more than 379mn cinema tickets were sold in India, a healthy increase year-on-year on the 278mn admissions in 2020 (and higher than the 226mn admissions in the US in 2020) though that had been a huge (-85.4%) drop as compared to the 1.9bn tickets sold pre-pandemic.
Internet advertising: India’s Internet advertising market is set to increase at a 12.1% CAGR to reach INR 28,234Cr by 2026. Given India’s mobile-first Internet access market, the mobile sector dominates the country’s Internet advertising market, accounting for 60.1% of total revenue in 2021, rising to 69.3% by 2026. Display advertising dominates the mobile sector, accounting for 90.7% of revenue in 2021 though its share will fall to 88.9% of the total in 2026. India’s wired Internet access revenue amounted to INR 6,379Cr in 2021 which is predicted to increase at a 6.3% CAGR to reach INR 8,829Cr by 2026.
Music, Radio & Podcast: India’s music, radio & podcast segment grew at 18% in 2021 and is set to grow at 9.8% CAGR to reach INR 11,536Cr by 2026. India’s Recorded Music industry (which is a key sub-segment) is making steady progress at a CAGR of 13.6%, thanks to streaming models. Here the revenue has grown from just INR 1,663Cr in 2017 to INR 2,568Cr in 2021, and is expected to continue on this path to INR 4,849Cr by 2026.On the other hand the country’s Live Music industry remains small, and it shed two-thirds of its revenue in the first year of the COVID-19 pandemic. Revenue ticked up in 2021 to INR 434 Cr and is forecast to grow to revenues of INR 1,052 Cr in 2026, increasing at a 19.2% CAGR.
Other factors impacting the global M&E sector:
Global Revenue – Fastest growing segments
After a stellar 2021, virtual reality (VR) continues to take steps towards becoming a mass-market proposition. VR gaming content is the primary contributor to total revenue, bringing in US$1.9bn in 2021 and highest CAGR for the forecast period. Total cinema revenue will rise globally over the forecast period, and the pandemic-driven losses experienced in 2020 will be reversed, with the market hitting new heights in 2023. Box office revenue is set to reach US$49.4bn in 2026. Internet advertising comfortably leads the way as the largest advertising segment. An exceptional 31.6% year-on-year rise in 2021 put total global Internet advertising revenue at US$468.4bn, up more than US$112bn in absolute terms in 2020.
The metaverse awaits
In the not-too-distant future the metaverse could become a stunningly virtually realistic world where individuals access immersive virtual experiences, through VR headsets or other connecting devices. Because the metaverse is an evolution that may profoundly change how businesses and consumers interact with products, services and each other, its potential financial and economic value goes far beyond VR. In time, much of the revenues associated with video games, music performances, advertising and even e-commerce could migrate into the metaverse.
How big is the E&M opportunity in the metaverse? The fast-growing market for VR is a starting point to consider. It is currently one of the smaller segments tracked, but the 36% rise in global spending over the past year is a hint of its long-term potential. The global installed base of stand-alone and tethered VR headsets is projected to grow from 21.6m in 2021 to 65.9m in 2026.
Werner Ballhaus, Global Entertainment & Media Industry Leader, PwC Germany, said: “Industry press tends to focus on the companies that have dominated the E&M industry. But it is the choices that billions of consumers make about where they will invest their time, attention and money that are fueling the industry’s transformation and driving the trends. We are seeing the emergence of a global E&M consumer base for the coming years that is younger, more digital and more into streaming and gaming than the current consumer population. This is shaping the future of the industry.”
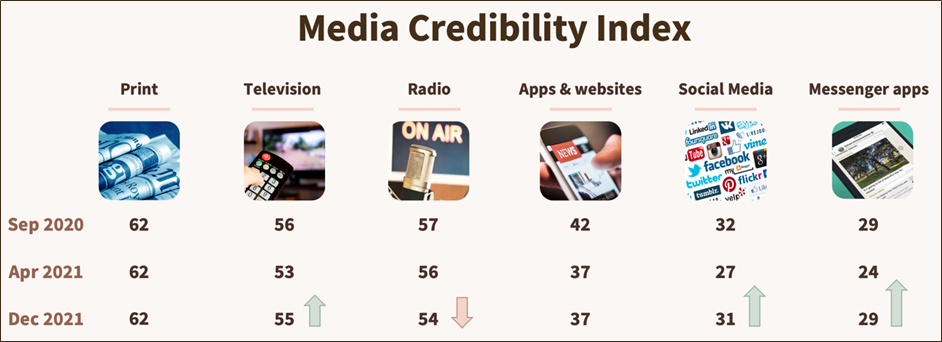
 Commenting on the findings of the report, Shailesh Kapoor, Founder & CEO – Ormax Media said: “Fake news, and lack of news credibility in general, continues to be a growing concern globally. Almost 2 out of 3 Indians see fake news as a problem, and that should be a major cause of worry for all news companies. We launched this report in 2020 to enable more informed conversations on this topic. In the subsequent editions, we plan to study these indices by languages, to understand if there’s a difference in news credibility between Hindi, English and other major Indian languages”.
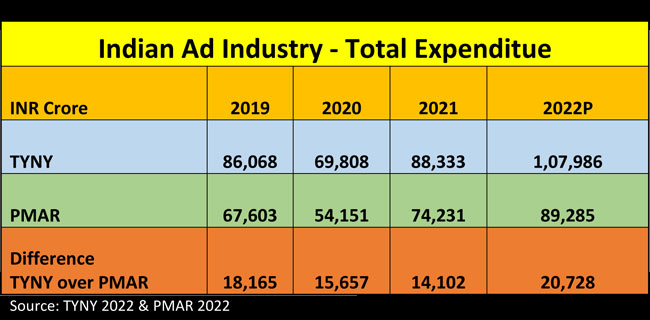
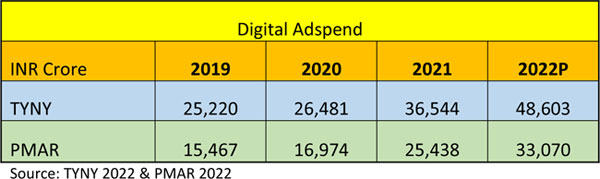
 Last week, both GroupM’s This Year Next Year (TYNY) and Madisons Media’s Pitch Madison Advertising Report (PMAR) got released and their basic findings have already been reported by all business and trade media. The general mood in the advertising industry is exuberant as both the reports have confirmed that AdEX zoomed in 2021, by 37% as per PMAR and by 26.5% as per TYNY in spite of the third wave of the pandemic. In 2021, India was the fastest growing market in the top 10 countries, ranking 9 globally and ranking 5 on incremental ad spend predicted for 2022.