Category: RESEARCH

  • AdEx grew 21% in 2022, to grow 16% in 2023: Madison


    By Our Staff

    Madison Media presented its predictions for the advertising industry for 2023.  The highlights of the report were released by Sam Balsara, Chairman, Madison World. According to Madison Media, AdEx has grown by 21% in 2022 to reach Rs. 89,803 crore. AdEx is expected to grow further in 2023 by 16% and will cross the landmark Rs. 1 lakh crore number to settle at Rs. 1,04,230 crores. In 2022, Digital grew by 35% to become the largest medium in AdEx with a 38% share, compared to TV’s 34%. TV grew by a modest 9% vs our projection of 14%.


    Figures at a glance:


    Key findings of the report:

    A. Overall:

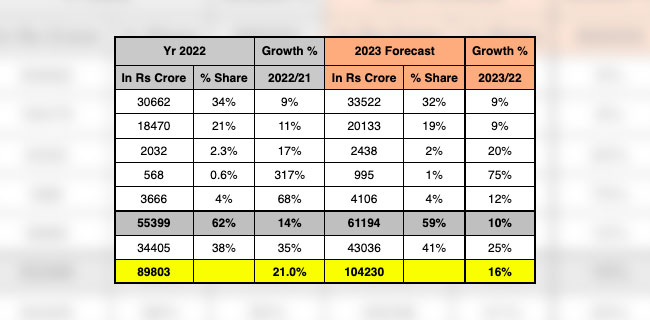
    1) In 2022 total AdEx grew by 21%, Traditional AdEx by 14% and Digital AdEx by as much as 35%.

    2) Compared to Indian AdEx growth rate of 21%, Global AdEx, according to WARC grew by just 8% in 2022. The Top 11 countries that account for 70% of Global AdEx grew by only 1%.

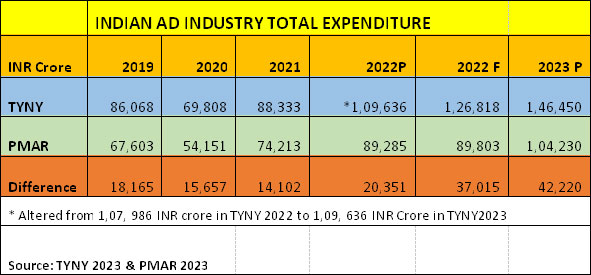
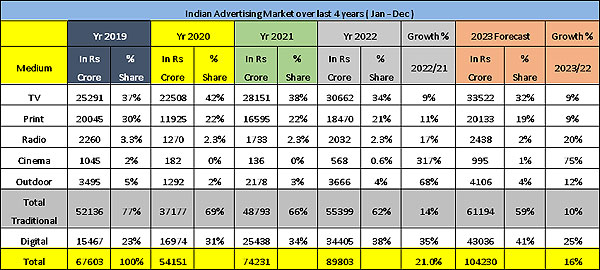
    3) In absolute terms, AdEx has grown from Rs. 74,231 crore to Rs. 89,803 crore and this is the second highest gain of the last two decades.

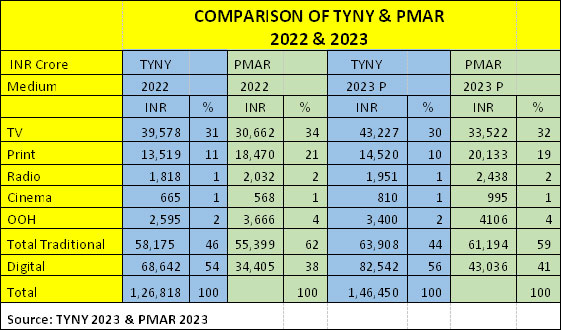
    4) Traditional AdEx dominates Indian AdEx with a 62% share, whereas in Global AdEx the figure is 32%.  With a growth of 14% in 2022, Traditional Media at Rs. 55,399 crore, has just crossed its 2019 figure of Rs. 52,136 crore.

    5) Digital AdEx is now the largest medium with a share of 38%, followed by TV with a share of 34%.

    6) The Audio Visual medium contributes to 45.6% of total AdEx. Linear TV at Rs. 30,662 crores and Digital Video at Rs. 10,314 crores, totalling to Rs. 40,976 crores.

    7) FMCG continues to be the largest category, but its share has moved down from 38% in 2020 to 32% in 2022.

    8) Ecommerce has now established itself as the 2nd biggest category of AdEx, growing in Share from 4.9% in 2019 to 14% in 2022.

    9) The Top 5 Advertisers in AdEx are HUL, Reckitt, RIL, Dream11 and Mondelez. There are only 11 Start-Ups in the Top 50 Advertisers List vs 15 last year, confirming that VC money is drying up.


    B. Digital

    1) Digital grew by 35% in 2022, on top of a 50% increase in 2021, to reach Rs. 34,405 crore and has emerged the largest medium in AdEx with a 38% share, overtaking TV.

    2) A 10-year review shows that Digital has grown from a mere Rs. 3,050 crores with a 9% share, to Rs. 34,405 crores with a 38% share today.

    3) Inspite of all this growth, Digital AdEx in India trails behind Global AdEx. Digital share in Global AdEx is 68%.

    4) Video, Social, Display, Ecommerce and Search drive Digital AdEx. Digital Video continues to dominate Digital AdEx and having grown by 40%, has further improved its Share from 29% to 30%.

    5) Social grew the most at 45% and increased its Share from 20% to 22%. Display has grown more modestly at 19% and has lost 3 percentage Share points from 19% to 16%. Search has grown by 32%, but is only 16% of the market.

    6) Ecommerce has registered a 35% growth and now has a share of 16% of Digital AdEx. Whilst Google and Facebook account for the lion’s share of Digital ADEX, Amazon and Flipkart account for almost 80% of Ecommerce spends.

    7) Digital is going to continue to fuel growth of AdEx in 2023. It is expected to grow by 25% to reach Rs. 43,036 crore and increase its share to 41% of AdEx.


    C. Television

    1) TV registered a modest growth of 9%, against our forecast of 14% to reach Rs. 30,662 crore.

    2) In 2022, for the first time we see signs of stress in Linear TV and its Share has come down from a high of 42% in 2020 and 38% in 2021 to a new low of 34%. With increasing spends in Digital, TV has now moved down to number 2 position in the Indian AdEx.

    3) TV has also seen a 8% decline in viewership over the last year, and a 13% drop compared to pre-Covid year 2019.

    4) TV has seen a marginal drop in Advertisers from almost 11,000 in 2021 to less than 10,500 in 2022.

    5) FMCG continues to be the largest contributor to TV AdEx with a share of 45%. Ecommerce, the 2nd largest contributor to TV AdEx, further increased its share from 18% to 20%, followed by Auto which has maintained its share at 5%.  Education has dropped its share from 6% to 4%.

    6) In terms of Genres, Hindi GEC 2 has registered the highest growth of 47% followed by Sports at 22%. News, witnessed a degrowth during last year. Among the regional satellite channels, Tamil continues to rule the roost, followed by Telugu, Marathi, Bengali, Kannada and Malayalam in that order.

    7) TV AdEx is expected to grow by 9% in 2023 to reach Rs. 33,522 crore.

    8) FMCG, the largest category of TV Market, is likely to substantially increase its Advertising budgets, instead of reducing consumer prices because of lowering of raw material inflation.


    D. Print

    1) Print AdEx grew last year by 11% to reach Rs. 18,470 crores, a little short of its pre-covid figure.

    2) Both Volume and Value in Print have gone up by 15% and 11% respectively.

    3) H2 performed well for Print and 58% of its AdEx came from H2 vs only 46% in pre-Covid year 2019.

    4) In terms of category contribution, although, Education de-grew marginally, it has emerged as the largest category in Print overtaking FMCG, which grew by as much as 8%. Two other large categories, Clothing, Fashion & Jewellery and Household Durables grew substantially by over 50%.

    5) In terms of languages, Hindi Publications continue to dominate, followed by English and Marathi, the latter two having grown by 19% over 2021.

    6) We expect Print AdEx to grow at 9% in 2023, to reach Rs. 20,133 crore and reach pre Covid levels.

    With this growth, its Share will be 19%, compared to Global AdEx where it is a mere 4%.


    E. Other Media

    1) OOH AdEx has registered a high growth of 68% on the back of a growth of 69% the previous year, taking the industry to Rs. 3,666 crore and surpass its pre Covid level.

    2) Digital OOH continued to be the growth driver with its big bright, colorful and moving displays.

    3) Radio AdEx has grown by 17% to reach Rs. 2,032 crore, but it is still at 90% of its pre Covid level. Its Share in total AdEx is at 2%.

    4) Real Estate has emerged as the largest category in both OOH and Radio, pipping FMCG.

    5) Although Cinema grew by 317%, it has reached only the half way mark of its pre Covid number of Rs. 568 crore. But with new movies coming up, we expect Cinema to grow by 75% this year and reach Rs. 995 crore, almost upto its pre pandemic level.


    Added Balsara: “Indian AdEx is the bright spot in a relatively dull and uncertain global environment. Our AdEx has grown by leaps and bounds in the last 3 years marked by Covid and the War, except in 2020. However, media habits of Indians are rapidly changing and this is reflected in our AdEx numbers and commentary. Advertisers who ignore these changes will do so at their own peril.”


    Bharat Puri, Managing Director, Pidilite Industries Limited who launched the report said: “Experiment, innovate, know your consumer and don’t be afraid of failure”. He said, “Whilst chasing impressions, don’t forget to make an impression!”


  • A Tale of Two Reports


    By Indrani Sen


    Indrani Sen
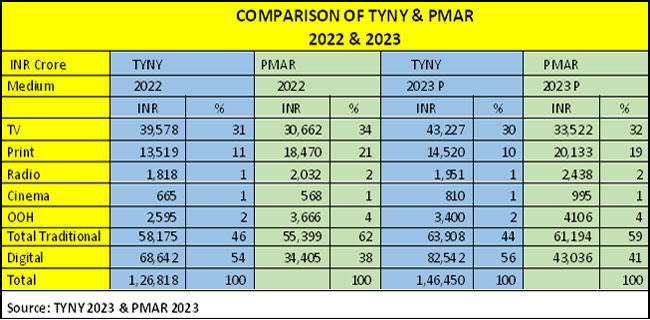
It is time to celebrate as the TYNY (This Year Next Year) 2023 report released by GroupM last week declared that the total value of Indian AdEx in 2022 has crossed the 100K crore mark touching INR 1,09,636 crore and in 2023 is estimated to grow at a healthy rate of 15.5% over 2022 towards another milestone of 150K crore (predicted as INR 146450 crore in 2023). Digital AdEx with an estimated 30% growth rate is expected to power the overall growth. India continues to be the fastest growing advertising market and as per the TYNY report has moved up from 9th position to the 8th position among the Top 10 countries with a share of 2% of the global adspend.


    As per the tradition set up over the last few years, the PMAR (Pitch Madison Advertising Report) 2023 was also released last week with a prediction that Indian AdEx will cross 100k crore mark in 2023 (predicted as INR 104230 crore) with a growth rate of 16% over 2022. Digital AdEX with an estimated 25% growth rate provide momentum to the growth.


    Both the TYNY and PMAR have been predicting in the same line over last few years with the gap between their estimates of the size of Indian AD Industry becoming wider year on year. By 2023 the size of the gap in the two estimates will be 40% of the total Indian ADEX size estimated by PMAR and by 2025 the size of the gap may become 50% of the Indian ADEX estimated by PMAR!! Globally is quite common to have difference in the estimates of the AD Industry size / AdEX estimated by different organisations, but if the difference becomes huge then it causes serious concern.


    Six years back, I wrote here an article comparing the estimates of TYNY 2017 and PMA 2017 https://www.mxmindia.com/2017/02/what-is-the-real-size-of-indian-ad-industry/. In that year, the estimates for Digital AdEx by the two agencies were almost the same, INR 7000+ crore in 2016 and INR 9000+ crore in 2017. However, the TV AdEx estimated by TYNY was considerably higher than the TV AdEx estimated by PMAO and hence the total Ad Industry expenditure estimated by TYNY was around INR 6000 crores higher than the that of PMAO.


    It is interesting to note that over the last six years, Digital AdEx has increased at a much higher rate in the TYNY reports than in the PMAR reports. In 2022, the Digital AdEx INR 68,642 crore reported by TYNY was double the estimate INR 34,405 crore shown by PMAR.  AS per the TYNY report, Digital ADEX now has more than 50% share of the total AdEx, while in the PMAR report total traditional media is still enjoying around 60% share of the total AdEx as shown in the table below.


    The various industry websites including www.mxmindia.com and financial/ business publications have already reported on the findings of the two reports. Digital did not suffer during the three waves of Covid-19,  among the traditional media TV was the first to recover its pre pandemic revenue, outdoor recovered in 2022, print, radio and cinema are expected to recover in 2023. On the whole. 2022 was a good year for Indian Advertising and the immediate future looks bright.


    In spite of the widening rift between the TYNY and PMAR estimates, their leaders agree on the future directions. Prasanth Kumar, South Asia CEO, GroupM has said “As technology redefines interactions between consumers, brands and businesses the ad industry must navigate thru this changing environment.” Sam Balsara, Chairman and Managing Director, Madison World has advised the advertisers “to take advantage of the evolved digital infrastructure for distribution and advertising to prepare for the future growth and to invest in building their own D2C channels.” Only if the two agencies could stop the widening rift between the two reports, we would be in a happier situation.


    Indrani Sen is a veteran industryperson and educator. This is a new season of her Monday column on MxMIndia. Her views here are personal.


  • Lego is Top #1, again


    By Our Staff


    Denmark’s Lego is the world’s most valuable toy brand for the ninth consecutive year, according to a new ranking fromleading independent brand valuation consultancy, Brand Finance. This came as Lego saw a 24% year-on-year brand value increase to US$7.4 billion. Best known for its iconic Lego bricks, the toy production company’s brand value accounts for a quarter of the value of the whole ranking and is worth more than four times as much as the next most valuable brand.


    US-based toy brands dominate the top 10, but Japanese brands still feature: Behind Lego, American toy brands dominated the top ten of the ranking, making up 7 out of 10. The country also accounted for 17 of 25 brands in the overall ranking, highlighting that the United States exerts significant clout in this culturally important sector.


    Despite the large number of American brands, the second most valuable toy brand is Bandai Namco (brand value down 9% to US$1.6 billion) from Japan. It remains in second spot despite experiencing a 9% brand value decrease this year.


    Magic: The Gathering (brand value up 123% to US$352.26 million) has built a huge global fanbase since its inception in 1993. However, it continues to invest in its future, building upon its strong live platforms to expand digital and online offerings.


    In addition to calculating brand value, Brand Finance also determines the relative strength of brands through a balanced scorecard of metrics evaluating marketing investment, stakeholder equity, and business performance. Compliant with ISO 20671, Brand Finance’s assessment of stakeholder equity incorporates original market research data from over 150,000 respondents in 38 countries and across 31 sectors.


    Ranked for the first time as a toy brand, Star Wars (brand value US$262 million) was the strongest brand with a Brand Strength Index (BSI) score of 88 out of 100 and corresponding AAA rating. The brand has benefited from a number of successful films and spin off series in recent years resulting in strong brand equity amongst consumers along with highly-regarded toys.


    Marginally behind Star Wars as the second-strongest brand was Fisher-Price (brand value up 18% to US$879 million) and a Brand Strength Index of 88 and AAA brand rating. It was also the 3rd most valuable brand in the ranking and the most valuable American toy brand in the ranking.


  • 37% spend more than 1 hour on OTT: Axis My India study

    By Our Staff


    Axis My India, a leading consumer data intelligence company, released its latest findings of the India Consumer Sentiment Index (CSI), a monthly analysis of consumer perception on a wide range of issues. The March report highlights that consumption of media such as TV, Internet, Radio has increased for 19% of the families. Moreover, the survey on media consumption reveal a deeper penetration & time spent on OTT platform amongst Indian viewers.


    Commenting on the CSI report, Pradeep Gupta, Chairman & MD, Axis My India, said: “Over-the-top (OTT) consumption has been steadily growing among Indian consumers in recent years, particularly with the increasing availability of affordable high-speed internet connectivity and the widespread adoption of smartphones. The COVID-19 pandemic has also contributed to the growth of OTT consumption in India, with more people spending time at home and seeking entertainment options online. Many OTT platforms have reported a surge in viewership during the pandemic. Overall, the trend towards OTT consumption among Indian consumers is expected to continue in the coming years, driven by the growing demand for digital content, and the convenience of watching content anytime, anywhere, on any device.”


    Key findings on Media Consumption Behaviour

    >> Consumption of media (TV, Internet, Radio etc.) has increased for 19% of the families, which reflects a decrease by 1% from last month. The overall, net score, which was at 0 last month, is at -1 this month


    >> The survey also threw light on the OTT (Over-the-top) viewing behaviour of viewers. According to the survey, 29% spend 1-3hrs watching content on OTT platforms, while 26% spend upto 30 minutes on OTT platforms. 23% watch content for 31mins-1hr and interestingly there are 8% who watch it for more than 3 hours


    >> Moreover, the survey also discovered that 24% share their OTT passwords with their friends & family


    On topics of current national interest:

    >> Axis My India CSI survey deep dived to understand citizens’ sentiments towards the 2023 Union Budget. The survey found out that 52% were pleased with the announcement, which sets out on a quest to fulfil the dreams of the corporates, farmers, and the middle class. However, 29% rated the budget unsatisfactory and only 10% had a neutral stance towards it.


    >> Further investigating sentiments, the study discovered that 72% believe that Indian economy would continue to grow in 2023 in comparison to previous year. The optimism stems from the country’s superior performance in dealing with unprecedented obstacles such as Covid, the Russia-Ukraine war, control of inflation as compared to other nations.


    >> The survey also highlighted that 43% believe that Sensex will go beyond 70,000 in the next three months. Whereas 25% believe that, it will remain between 55,000 to 65,000. Additionally, 18% believe that it will drop below 50,000.


    Key findings on the five indices

    >> Expenses towards health-related items such as vitamins, tests, healthy food has surged for 35% of the families. This reflects an increase in consumption by 2% from last month. The health score which has a negative connotation i.e., the lesser the spends on health items the better the sentiments, has a net score value -24 this month.


    >> Mobility has increased for 7% of the families, which reflects a decrease by 2% from last month. The overall mobility net indicator score, which was at +2 last month, is at zero this month.


    >> Overall household spending has increased for 58% of families, decrease by 1% from last month. The net score, which was +52 last month has decreased by 1 to +51 this month.


    >> Spends on essentials like personal care & household items has increased for 36% of the families, which reflects a dip by 4% from last month. The net score, which was at +29 last month, has decreased by 6 to +23 this month.


    >> Spends on non-essential & discretionary products like AC, Car, and Refrigerator has increased for 4% of families, which reflects a decrease by 1% from last month. The net score, which was at +1 last month, is at zero this month. Sentiment towards discretionary spending has steadily decreased over the last four months.


  • COMvergence releases New Business Barometer FY 2022 India report

    By Our Staff


    COMvergence an independent research and data consultancy, which analyses media spend investments and produces benchmark studies on new business performances, released its latest New Business Barometer for the FY 2022 for India.


    India saw a lower number of account moves and retentions this year of 246 with media spends estimated to be around $1.5BN as compared to a higher number of account moves in 2021 which were 332 with media spends estimated to be around $2.3BN


    In 2022, 66% of the total pitches held globally were local in nature ( country specific pitches) India was well above this average with 81%  of total pitches being local which is $1286M whereas global and multi- country pitches made up 19% of the pie with  $297M in 2022 for India.


    Mondelez ,Pepsico, ITC, Nestlé, Meesho, Lenovo, Hyundai-Kia, NPCI, Abbott Nutrition, Rebel foods, Truecaller were among some of the  account moves that dominated the Indian market in 2022.


    The Media Agency Groups were led by GroupM with a total new business value of +$332M, followed by Publicis Media Group at +$289M new business value and dentsu International with a new business value of +$194M respectively.


    Zenith from the Publicis Media Group stable and Wavemaker from the GroupM umbrella led the media agencies’ ranking, interestingly the 3rd rank was tied between Initiative,  Havas Media and Spark Foundry ( Publicis Media Group) followed by Madison Media and Carat.


  • ‘57% prefer watching IPL on TV, 30% on mobile’


    By Our Staff


    Pause for a moment. Look to the left or right of the screen. Or text in a different colour. This is no marketing initial or promotional exercise done at the behest of one of the competing platforms. It’s the main finding of an Axis My India survey of 10,034 people surveyed, 66% of who are from Rural India while 34% are from Urban India. This is part of the India Consumer Sentiment Index (CSI), a monthly analysis of consumer perception on a wide range of issues. The April report highlights that 19% of families have reported a rise in media consumption. Moreover, the survey reveals that urban areas and male viewers are leading the surge in media viewership. The enthusiasm for IPL is expected to increase further, with both TV & mobile contributing to viewership. The study also delved into the key factors that influence consumers’ buying decisions, revealing that product quality and brand name remain important considerations. Additionally, the survey sheds light on the role of celebrity endorsements in driving product purchases, with younger age groups being more susceptible to their influence.


    The April net CSI score, calculated by percentage increase minus percentage decrease in sentiment, is at +8, which is the same as last month. The corresponding net score last year was +11.


    The sentiment analysis delves into five relevant sub-indices – Overall household spending, spending on essential and non-essential items, spending on healthcare, media consumption habits, entertainment & tourism trends.


    The survey was carried out via Computer-Aided Telephonic Interviews with a sample size of 10,034 people across 33 states and UTs. 66% belonged to rural India, while 34% belonged to urban counterparts. In terms of regional spread, 25% belong to the Northern parts while 26% belong to the Eastern parts of India. Moreover, 28% and 21% belonged to Western and Southern parts of India respectively. 63% of the respondents were male, while 37% were female. In terms of the two majority sample groups, 29% reflect the age group 36YO to 50YO and 29% reflect the age group of 26YO to 35YO.


    Commenting on the CSI report, Pradeep Gupta, Chairman & MD, Axis My India, said: “Closely examining the findings of our latest survey, it is clear that media consumption habits are not uniform across demographics, with variations emerging among different age and gender groups. It is noteworthy that younger age groups are showing a greater appetite for media consumption, with a particular interest in watching the Indian Premier League. Digital is expected to contribute significantly to the rise of IPL viewership. As we delve deeper into consumer behaviour, it is evident that product quality and brand name remain key considerations, but we are also seeing a significant impact of celebrity endorsements on purchasing decisions, especially among younger age groups. These insights highlight the need for brands to stay attuned to the evolving consumer preferences and tailor their marketing strategies accordingly to drive engagement and enhance customer loyalty.”


    On topics of current national interest


    • :: • This month Axis My India’s CSI survey further deep dived to understand citizens’ sentiments towards the 16th edition of Indian Premier League. As per the survey 42% would watch IPL this season, out of this 19% would watch all the matches whereas 22% would only watch matches where their ‘favourite’ teams will play or critical matches like eliminators and finals. About 26% of youngsters (18-25YO) wants to watch all the matches as compared to older age group highlighting their younger spirit and interest in IPL. In addition, male viewers and urban areas show more interest in watching the tournament.

    • :: • Further investigating sentiments, the study discovered that 57% would watch the matches only on cable/DTH Television sets while 30% will watch it only on mobile – Jio Cinema. 8% said they would watch on both TV and mobile. 3% plans to watch the tournament physically from the stadium. About 32% from rural areas show more interest in watching IPL on mobile given the free telecast of IPL matches. Middle age groups, of 26-50 YO would prefer watching more on television than younger age groups.

    • :: • In an attempt to understand product purchase behaviour, the survey found out that 52% considers product quality and 33% considers brand name as important factors. 60% of 18-25YO puts weightage on the product quality whereas 35% of 36-50YO considers brand name as important factors. Price is overall considered as the third most important factor with a vote of only 22%.

    • :: • The survey also unveiled that advertisement in which celebrities feature, influence product buying decisions of 30% to some extent. Of this, about 35% of them are youngsters (of age 18-25) and 27% are middle-old and older age group.

    • :: • With summers approaching, the survey highlighted that overall 15% plans to buy durables like AC or Refrigerators in the next 2-3 months. Moreover 19% of youngsters (18-25 YO), highest amongst all age groups are considering to buy durables like AC, fridge etc. this summer season.

    • :: • The survey also threw light on consumer travel plans this summer season. Overall 24% plans to travel of which 23% said they are planning for a domestic holiday while 1% is planning for an international vacation. Plans of travel is higher in the younger age group of 18-25 years at 30%.

    • :: • On employment opportunities the survey revealed that 50% believe that there are more openings/opportunities as compared to last 10 years. 53% of the female population have a positive outlook regarding the same highlighting the raise in the number of jobs available for the gender. In addition, younger age group (18-25YO) also thinks job opportunities have increased overtime.

    • :: • Moreover, the survey discovered that among the top professions in the country 25% would prefer their children to enrol in the Govt service, 16% would prefer them to be in medical profession while 10% would prefer them to work in fields related to Engineering, Computer application, IT. A majority of 35% are of the view that their children should do whatever they want to do.


    Key findings


    • :: • Overall household spending has increased for 56% of the families, this reflects a decrease of 2% from last month and 6% from April’22. The net score, which was +51 last month and +53 in April’22 has reduced to +49 this month. The two states, which reflected the highest increase, are Telangana with 70%, followed by Andhra Pradesh with 66%. The age group between 26-50 showcased the highest increase (58%).

    • :: • Spends on essentials like personal care & household items has increased for 33% of the families, which reflects a dip by 3% from last month and 15% from April’22. The net score, which was at +23 last month and +29 in April’22, has decreased to +21 this month. Essential spends has increased more for rural segment (33%) as compared to the urban counterparts (31%). Karnataka and Tamil Nadu reflects the highest essential spends with 50% and 49% respectively. The age group between 36-50 showcased the highest increase (36%).

    • :: • Spends on non-essential & discretionary products like AC, Car, and Refrigerator have increased for 4% of families, which is the same as last month and reflects a dip by 9% from April’22. The net score, which was at 0 last month, remains the same.

    • :: • Expenses towards health-related items such as vitamins, tests, healthy food has surged for 32% of the families. This reflects a decrease in consumption by 3% from last month and 6% from April’22. The health score which has a negative connotation i.e., the lesser the spends on health items the better the sentiments, has a net score value -22 this month. Health related products consumption increased more in rural areas (33%) and among age group of 26-35 (about 34%). Karnataka with 49% and Bihar with 43% reflect the highest spends in health-related products.

    • :: • Consumption of media (TV, Internet, Radio etc.) has increased for 19% of the families, which is the same as last month and reflects a dip by 3% from April’22. The overall, net score is at 0 this month. Media viewership has increased more in urban areas (21%) and among males (20%) while it is only 17% among females. In addition, media consumption is more among 18-25 YO which (29%) as compared to older age groups.

    • :: • Mobility has increased for 6% of the families, which reflects a decrease by 1% from last month and same as April’22. The overall mobility net indicator score, which was at 0 last month, is at -1 this month. 10% of the youngsters from the age group of 18-25, has gone out more in the last month as compared to other age groups.


  • India sports grows 49% to 14kcr


    By Our Staff


    GroupM ESP launched the 10th edition of the Sporting Nation Report 2023 on sports sponsorship in India on Wednesday. The Indian sports industry witnessed a significant growth curve in 2022, with spends crossing over INR 14,000 crore.


    Sporting Nation 2023 highlights the growth of sports sponsorship in India, with spends on-ground, team, and franchise rising by INR 3021 Cr, a 105% growth from 2021, making the total sponsorship spends INR 5907 Cr. The overall increase in spends was due to the rise in the number of IPL matches, the addition of two new IPL teams, the ICC T20 World Cup, Asia Cup, FIFA World Cup, and the return of emerging sports events and tournaments like PKL, marquee marathons, Maharashtra Open, and Commonwealth Games 2022. Indian women athletes and women cricketers saw a phenomenal rise, with the Indian women’s cricketers making a name for themselves on the international stage.


    The report highlights key aspects of how brands are expected to approach spending on sporting events differently with the rise of OTT, and the sports industry is one of the better-performing sectors in the economy with a 14% CAGR. Two big international racing events, Formula E & Moto GP, are to be held in India for the first time in 2023. The renewal of IPL Sponsorships post the 2023 season, BCCI Home Series Title ad Central Sponsorship along with team India sponsorship, BCCI Home Series Media Rights, and the inaugural season of WPL in March 2023 will be the tipping point for Indian cricket. Overall, the rise of Indian cricket, the performance of Indian athletes and the number of emerging sports leagues have all contributed to India becoming a sporting nation in the last ten years.


    The report reveals that cricket continues to dominate the Indian sports sponsorship landscape, contributing to 85% of the sponsorship spends, while emerging sports like football, kabaddi and marathon have seen a massive upsurge in the sponsorship spends, contributing to the remaining 15%.


    The growth of cricket sponsorship can be attributed to several reasons, including the Indian cricket team playing almost the double number of matches, as compared to 2021. The Indian Premier League (IPL) contributed the major revenue by adding two new franchises – Gujarat Titans and Lucknow Super Giants, and a full house of central sponsorship.


    Said Prasanth Kumar, CEO – GroupM South Asia:  “The Indian sports ecosystem is experiencing a revolutionary transformation, with athletes becoming influential role models for the youth and sports sponsorships gathering immense momentum. In this scenario, brands hold tremendous potential to tap into the passion and loyalty of Indian sports fans. Despite facing unprecedented pandemic challenges, the exceptional performance of the sports industry in 2022 reflects its resilience and unwavering commitment. As we move forward, technology will play an increasingly pivotal role in content management and fan engagement, while opening new and exciting opportunities in sports. Live sports will continue to be highly coveted as monetizable properties, making it a promising sector for investment.”


    Commenting on the report’s findings, Vinit Karnik, Head – Sports, Esports and Entertainment, GroupM South Asia, said: “The Sporting Nation report illuminates the explosive growth of sports sponsorship in India, a testament to the nation’s fervent passion for sports and the industry’s enormous potential for brands. With the rise of new sports and leagues alongside the unparalleled popularity of cricket, brands have unprecedented opportunities to connect with fans through sports. The report also highlights the burgeoning trend of sports celebrity endorsement, with cricketing stars blazing the trail. Brands can leverage these insights to tap into the power of sports sponsorship and accomplish their marketing goals with unmatched effectiveness.”


    According to the Sporting Nation Report, the sports celebrity endorsement market in India has seen significant growth, with a 20% increase with total value of INR 729 Crore. Out of the 505 brand endorsement deals, 85% of the total brand endorsement value has come from cricketers. The top athletes in sports celebrity brand endorsement include Virat Kohli, MS Dhoni, Rohit Sharma, Sachin Tendulkar, Neeraj Chopra, and PV Sindhu. Cricketers’ endorsement has grown by 18%, with Virat Kohli, MS Dhoni, and Rohit Sharma endorsing over 30 brands each, and adding new brands in 2022. Other cricketers such as Hardik Pandya, Jaspreet Bumrah, KL Rahul, and Surya Kumar Yadav are also scoring big in the endorsement space. Neeraj Chopra and PV Sindhu continue to be leading the non-cricketing athletes leading the endorsement deals.


    The report also notes that apart from cricket leagues, the successful hosting of several other tournaments like Indian Super League, Pro Kabaddi, the Commonwealth Games, Prime Volleyball League, and Ultimate KhoKho, along with the return of marathons and the Women’s Indian Open Golf tournament also helped in building a diverse sports content portfolio in the country bringing in more eyeballs and creating multiple opportunities.


  • Search is King!


    Search marketing is on the cusp of its most consequential transformation since Google first introduced its sponsored keyword search auction over 20 years ago, and the more recent introduction of the use of data and algorithms to provide greater personalisation in search results.

    Now a third era of search beckons – one defined as much by image or video as text, and by artificial intelligence and natural language processing, in which marketers shift from targeting keywords to targeting intent and context.

    WARC Media’s latest Global Advertising Trends report, Search 3.0, explores the impact of retail media on advertisers’ paid search investments, the growing role of social platforms on search journeys, and the rise of generative AI search.

    Author of the report, Alex Brownsell, Head of Content, WARC Media, says: “The search market is on the cusp of an era of innovation. Google’s long-standing market dominance is set to come under unprecedented pressure as consumers pivot away from text-based search towards discovery on social, generative AI reinvents the search experience, and the explosive growth of retail media, the majority of which is search-orientated, continues.”


    Steady growth for search, even in tough times

    Amidst an ongoing digital ad market slowdown, traditional search spend (excluding retail media) is proving to be resilient. While global advertising investment is forecast to grow just 2.9% to $907.2bn this year, paid search, the largest media channel by ad spend globally, is set to increase 6.2% according to WARC Media.

    40% of the global search market is in the US, where WARC Media forecasts a robust 12% growth rate this year, taking its value to nearly $100bn.

    In APAC, where social commerce is far more established, paid search’s share of advertising budgets falls to 17%. Japan, the APAC market outside of China with the biggest search spend, is forecast to see search investment expand to $7.4bn in 2023. In China search spend is expected to grow to ¥131bn ($19bn).


    The search market, including retail media, is forecast to reach $350.4bn in 2023

    Retail media has transformed the search advertising market over the last few years. According to WARC Media and GroupM forecasts, total search advertising spend, is set to be worth $350.4bn this year, of which just over a quarter (26.8%) will come from retail media, valued at $93.8bn.


    As brands commit more budget towards retail media, and the number of platforms increase, marketers may be forced to make trade offs where their ad spend goes. Advertisers will also need to rethink their approach to paid search and SEO, and particularly how their brands show up towards the bottom of the purchase funnel.


    Search experiences are fragmenting across platforms

    Younger audiences increasingly favour searching for information and inspiration on visual platforms such as TikTok, Instagram, Pinterest and YouTube or RED, Douyin and Zhihu in China. According to data from GWI, in 2020, 19.2% of internet users turned to TikTok to search, rising to 27.5% last year.

    As search evolves into a “system for exploration” and search strategies diverge depending on category and demographic, Google’s dominance of the global search advertising market is being challenged.

    According to WARC Media, whilst Google remains the dominant force in search and is forecast to earn $176.4bn in advertising revenue in 2023, its share of total search, which includes retail media, is set to drop from 51.0% in 2021 to 50.4% in 2023.

    Over half (53%) of global advertisers surveyed by WARC for The Marketer’s Toolkit 2023 report said they plan to increase ad investment with Google this year, down from 59% the previous year.


    Generative AI threatens to disrupt search behaviour

    A race has begun to develop the most compelling AI chatbot search product. Microsoft plans to incorporate OpenAI’s ChatGPT – estimated to have become the fastest-growing app in history, reaching 100 million monthly active users in only two months – into Bing.

    However, as it stands, Bing is only forecast to earn a 5.2% share of the global search market in 2023, per WARC Media. Yet the news was deemed a “code red” situation for Google, which has subsequently rushed to launch Bard, its conversation technology.

    The arrival of generative AI will cause major considerations for brands, such as how paid ads will fit into the conversational nature of the content, the partiality of chatbot responses, risk of content misinformation and misalignment with brand guidelines.


    Download a complimentary sample report of WARC Global Ad Trends: Search 3.0 here.


    Global Ad Trends, is a quarterly report which draws on WARC’s dataset of advertising and media intelligence to take a holistic view on current industry developments. It is part of WARC Media, which provides rigorous and accurate benchmarks aggregated and verified from over 100 reputable sources, empowering media decision makers to plan strategies with precision. WARC Media is available by subscription.

  • TCS tops Interbrand Most Valuable Brands list


    By Our Staff


    Interbrand, the world’s leading brand consultancy, proudly presents the eagerly awaited list of India’s Top 50 most valuable brands. The unveiling event took place in Mumbai, with Rajashree R, Chief Marketing Officer, TCS, joining Gonzalo Brujo, Global CEO, Interbrand, as keynote speaker.


    Celebrating its 10th year, the Best Indian Brands report has become a definitive guide to the nation’s brand landscape since its inaugural publication in 2014. This year’s edition showcases remarkable growth, with a total list value of INR 8,310,057 million (US$ 100 billion), marking a significant 167% increase over the past decade. Notably, this is the first time the total value of the table has surpassed the US$ 100 billion mark.


    The rankings for 2023 reveal the following brands as the frontrunners:


    The top three brands alone account for a staggering 46% of the total value of the Top 10 brands. Additionally, the top five brands collectively contribute 40% to the overall value of the table. This year marks a historic moment, as three technology brands secure positions in the top five for the first time in the past decade. The top ten brands in the table have achieved remarkable scores across three of Interbrand’s Brand Strength Factors: Trust, Distinctiveness, and Empathy.


    The total brand value of the Top 10 brands, amounting to INR 4,949,920 million, exceeds the combined value of the remaining 40 brands on the list, which amounts to INR 3,360,137 million.


    Examining the fastest-growing sectors over the last ten years, FMCG demonstrates an impressive Compound Annual Growth Rate (CAGR) of 25%, followed by Home Building & Infrastructure at 17%, and Technology at 14%


    Highlighting the top ten fastest-growing brands over the past decade:


    The technology sector has overtaken diversified industries as the leading contributor to the total table value over the last decade.


    The Home Building and Infrastructure sector has experienced remarkable growth, surging from INR 69 billion to INR 344 billion, closely followed by Technology, which expanded from INR 693 billion to INR 2.5 trillion in the past 10 years.


    While the Financial Services sector still boasts the highest number of brands with nine representatives in the table, the Home Building & Infrastructure sector has witnessed the most significant rise, with seven brands entering the list since 2014.


    Said Ashish Mishra, CEO, Interbrand India & South Asia: “This year’s Best Indian Brands event highlights the remarkable concentration of brand value among the top three and top five brands, demonstrating their strong impact on the overall landscape. It is an extraordinary moment to witness the ascent of technology brands, securing prominent positions in the top five after a decade. The exceptional performance of the top ten brands, particularly in the Brand Strength Factors of Direction, Coherence, and Trust, underscores their strategic focus and ability to build lasting connections. With a total brand value surpassing the combined value of the remaining 40 brands, these leaders exemplify the power of effective brand management. The phenomenal growth of sectors such as FMCG, Home Building & Infrastructure, and Technology reflects their resilience and ability to adapt to evolving market dynamics. Notably, the Home Building & Infrastructure sector has witnessed a remarkable rise, welcoming seven new brands to the list since 2014. As we explore the ‘Brand New World,’ we are excited to celebrate the achievements and potential of these brands and their contribution to India’s economic landscape.”


    Said Gonzalo Brujo, Global CEO, Interbrand: “This year’s list showcases the remarkable growth and evolution of the Indian brand landscape. The significant increase in total brand value, surpassing the US$ 100 billion mark, is a commendable feat and demonstrates the strength and potential of Indian brands on a global scale. We are proud to witness the continued success and innovation of these brands, shaping the future of business in India.”


  • Dentsu releases report: ‘Impact of Influencer Marketing in India’

    By Our Staff


    Dentsu India has released its latest Dentsu Insights report titled ‘Impact Of Influencer Marketing In India’. The report has been created in collaboration with Recogn – dentsu India’s research division, Boomlet Group – an Influencer Marketing & Crisis Communication Agency and Digital Behaviour Initiative at IIT Delhi.


    The report delves into the various aspects of influencer marketing – shedding light on its transformative potential for businesses. By conducting thorough analyses of influencer marketing performance across different platforms, categories, formats, and target audiences, the report equips brands and industries with the tools and insights necessary to chart strategic pathways for success.


    According to the study, the FMCG sector leads the pack in leveraging influencer marketing, accounting for 18.5% of industry involvement, closely followed by BFSI at 16.6% and automobiles at 15.9%. While brand awareness has traditionally been the primary driver for influencer marketing (62%), the industry’s growth has prompted brands to explore additional avenues to enhance their customer-to-customer ratio. The surge in influencer marketing stems from its ability to amplify brand awareness. With the widespread adoption of social media, influencers have emerged as indispensable assets for promoting brands and driving product sales. They have become a pivotal component of an effective marketing strategy, as the content they create exerts a significant influence on customer behaviour.


    In the coming years, the virtual influencer market is set to grow significantly as brands and marketers realize the vast potential of incorporating virtual influencers into their campaigns. Advancements in technologies like artificial intelligence and virtual reality will enhance the capabilities of virtual influencers, driving their popularity even higher. The future of influencer marketing holds great promise with emerging technologies such as Virtual Reality (VR), Augmented Reality (AR), and Mixed Reality (MR). These innovations will revolutionize influencer marketing, captivating millennials and Gen Z, who avidly follow social media influencers. As AR and VR gain traction, brands and marketers will leverage these technologies to engage their target audiences through tech-driven influencer marketing strategies.


    Harsha Razdan, CEO, dentsu South Asia said: “Influencer marketing has revolutionized our approach to connecting with potential customers and elevating brand awareness. With the exponential growth of social media platforms, influencers have cultivated loyal and engaged followers – making them indispensable assets in our marketing strategies. They possess a unique ability to foster trust and credibility among their loyal followers. By partnering with influencers, brands can tap into this trust, build credibility, and authentically promote their products or services. The impact is tangible, with higher engagement rates, increased conversions, and improved brand sentiment. This report serves as an in-depth guide, equipping brands with valuable insights to shape their marketing strategies and drive business growth. As we look to the future, tech-driven influencer marketing strategies will continue captivating hearts and minds. The possibilities are limitless, and the potential for brands to connect with their target audience has never been more exciting.”


    Danish Malik, Co-Founder and CEO, Boomlet Group added: “The influencer marketing ecosystem thrives on trust, a fundamental principle that will significantly contribute to the exponential growth of the industry. Today, we are thrilled to introduce our Influencer Marketing Report, offering valuable insights into the ever-evolving landscape of influencer marketing. This comprehensive report is the culmination of meticulous research and analysis conducted through a strategic partnership among Boomlet Group, dentsu India’s Recogn, and the Digital Behaviour Initiative at IIT Delhi. As the influencer marketing space has emerged as a favored component of brand promotion, consumers rely on influencers’ perspectives to inform their purchasing decisions. Our report serves as an indispensable resource, equipping businesses with the knowledge to navigate the dynamic world of influencers and illuminating consumer behavior within this ecosystem. Boomlet is looking forward to working on more reports like this in the future.”


  • 44% view TV News as Most Trusted Source


    By Our Staff


    Axis My India, the leading consumer data intelligence company better know these days for its Exit Poll results, has unveiled its latest report on the India Consumer Sentiment Index (CSI). The survey shows the change in media consumption, particularly among younger demographics, with TV News Channels and Social Media dominating as primary news sources.


    The July 2023 Axis My India CSI survey aimed to understand the primary platform that consumers rely on to stay updated with the latest news. As per the findings, TV News Channels are the primary news source for 44% of respondents, followed by Social Media (23%) and YouTube education/news channels (18%). Newspapers accounted for only 14% of news consumption, while YouTube Shorts had 7%. TV News Channels and Newspapers are preferred majorly by viewers above 60 years while social media platforms and formats are majorly preferred by 18-25YO.


    Commenting on the CSI report, Pradeep Gupta, Chairman & MD, Axis My India, said “Amidst India’s ever-changing economic landscape, our comprehensive survey reveals fascinating patterns in media consumption, information seeking, and online shopping habits. Embracing the digital era, the youth drive a surge in digital platform usage, while traditional sources like TV news maintain steadfast relevance. The cinema’s revival is noteworthy, with urbanites and seniors spearheading this trend. Trust remains paramount, as consumers rely on shopkeepers, local markets, and online searches for product insights. However, data privacy concerns loom, particularly among the younger generation. These insightful trends underscore the imperative for a versatile approach to cater to the diverse preferences of our dynamic consumer base.”


    The survey was carried out via Computer-Aided Telephonic Interviews with a sample size of 5072 people across 35 states and UTs. 67% belonged to rural India, while 33% belonged to urban counterparts. In terms of regional spread, 23% belong to the Northern parts while 22% belong to the Eastern parts of India. Moreover, 26% and 29% belonged to Western and Southern parts of India respectively. 59% of the respondents were male, while 41% were female. In terms of the two majority sample groups, 31% reflect the age group of 36YO to 50YO and 27% reflect the age group 26YO to 35YO.


    Other findings:

    • Overall household spending has increased for 56% of the families, which is the same as the last two months. The net score, which was +48 last month is +47 this month. The increase is slightly higher in rural households (57%).

    • Spends on essentials like personal care & household items has increased for 31% of the families, which has decreased by 1% from last month. The net score, which was at +20 last month has dipped to +18 this month.Essential spends continue to increase majorly for the rural segment of the consumers (32%) and among 18-25-year-olds (38%).

    • Spends on non-essential & discretionary products like AC, Car, and Refrigerators have increased for 5% of families, which is the same as last two months. The net score is 0, which was same as the last month.

    • Expenses towards health-related items such as vitamins, tests, and healthy food has surged for 30% of families. This reflects a decrease in consumption by 2% from last month. The health score which has a negative connotation i.e., the lesser the spends on health items the better the sentiments, has a net score value -19 this month. Health-related products consumption increased more for the rural segment of the consumers (31%), among females (30%), and among those within the age group of 26-35-year-olds (34%).

    • Consumption of media (TV, Internet, Radio, etc.) has increased for 18% of families, depicting a significant dip in increased media consumption percentage by 6% from last month. This decrease is depicted after an increase was reflected last month at 24% (the highest since April 23) majorly due to IPL. The overall, net score which was at +4 last month is at -4 this month. The increase in Media viewership percentage could be majorly reflected among males (20%) and 18-25 YO (29%) compared to older age groups.

    • Mobility has increased for 8% of the families, which is the same as last month. The overall mobility net indicator score, which was at +2 last month, is at +1 this month. Mobility is highest amongst the age group of 18-25YO at 14% which is 2% more than last month for the same age group.

    • Another key aspect explored was the frequency of movie theatre visits in recent months. The findings reveal interesting patterns in consumer behaviour, where in out of all the respondents, 49% stated that they visited movie theatres once a month, 30% twice, 8% thrice, and 13% more than three times. As a significant proportion of consumers visit movie theatres at least once a month, it could be apt to assume that a consistent interest in cinema as a form of entertainment is again rising back. This keenness is majorly witnessed amongst urban consumers (51%), and females (57%).

    • When seeking information about products they intend to buy, respondents in the Axis My India survey relied on various sources. The primary sources of information were shopkeepers and local markets (36%), followed closely by internet searches (29%), indicating the significance of both traditional and digital channels. A notable 19% of respondents preferred seeking advice from friends, colleagues, or neighbours, highlighting the continued influence of word-of-mouth recommendations in purchase decisions. YouTube emerged as a source of product information for 6% of respondents, demonstrating the growing popularity of video content in informing consumer choices and Television advertisements held relevance for 5% of respondents. Only 2% refer to social media, and 1% go directly to the company website or use print media. While those above 60 years old prefer shopkeepers and local markets, 18-25YO prefer internet searches and YouTube videos. The majority of the 51-60YO prefer seeking advice from others.

    • The survey further unveiled a diverse range of online shopping habits among consumers with a sizable portion yet to adopt e-commerce as their preferred mode of shopping. A significant 64% stated they never shop online. However, 11% do online shopping once a month, and 7% do so once in 6 months to 1 year. Additionally, 6% shopped online once in the last 6 months, and another 6% did so more than once in the last month. Only 3% shopped online more than once in the last 6 months, while a mere 2% engaged in online shopping almost every week. 18-25YO forms the majority segment that shops once a month (19%).

    • The survey further gauged respondents’ sentiments regarding data privacy and security in the context of the increasing usage of the internet and technology in their daily lives. The findings reveal that 45% of respondents reported not being worried about data privacy and security, while 23% expressed a significant concern. Additionally, 26% reported being worried to some extent suggesting a moderate level of concern about data privacy and security. They may have a general awareness of the risks involved but may not be overly alarmed by them. A majority of 18-35YO reflect apprehension to a large extent.

    • Finally, the survey also focussed on farmers’ concerns about the potential repercussions of deficient monsoon on their farming activities in the current year. The findings revealed that 55% of farmers were highly worried, 24% expressed mild concern, 9% were optimistic about a good monsoon, and 13% expected normal monsoons. These findings highlight the apprehensions of a significant portion of farmers, emphasising the importance of addressing agricultural challenges and potential risks associated with monsoon variability.


  • TCS stays India’s most valuable brand


    By Our Staff


    Tata Consultancy Services (TCS) has retained its #1 position in the 10th edition of Kantar BrandZ Top 75 Most Valuable Indian Brands Report for the second consecutive year, with a brand value of US$43 billion. HDFC Bank, Infosys and Airtel also hold on to their top four positions, while State Bank of India rises one place to enter the Top 5.


    India’s Top 75 brands have a combined brand value of $379 billion, a decline of 4% from 2022 – a modest decrease given the ongoing economic volatility across most of the world. This is testament to Indian brands’ resilience, stability and consistency. The decline has been driven by brands in the Business Technology and Services Platforms category, which have a major presence in international markets, and therefore have been impacted by global pressures, recession threats and geopolitical instability.


    The Automotive category produced the Top 75’s two fastest risers: TVS (No.51; $1.90bn) and Mahindra (No.47; $2.01bn) and achieved the second highest category growth at 19%. India’s automotive brands have quickly responded to changing consumer needs, notably the shift in preference from hatchbacks to SUVs, and the demand for electric vehicles.


    TVS gained 59% in value and leapt 24 places thanks to a number of successful product launches and a 10-year partnership with BMW that gives it leverage in markets such as Europe, the US and Canada. Mahindra, which grew its value by 48%, has made itself incredibly meaningful in Indian consumers’ eyes, and has also significantly boosted its salience.


    The ranking’s 16 Financial Services brands contribute the biggest chunk of its total value. They grew 6%, thanks to the boom in digital banking, led by Axis Bank (No.17; +28%) and ICICI Bank (No.6; +18%).


    Telecom providers also performed strongly, resulting in a 17% rise in total brand value. Airtel (No.4; +29%) took full advantage of the end of the price wars to focus on what makes it special and relevant to Indian consumers’ lives. This included offering differentiated digital services, such as the Xstream entertainment app and Wynk music app. Airtel has also successfully leveraged the rapidly increasing demand among businesses for data and connectivity related solutions, and digital products that enable the delivery of an enhanced omni-channel customer experience.


    There are four newcomers to the 2023 Indian brand ranking, plus two re-entrants. PhonePe – the highest entry at No.21 – has quickly become India’s leading digital payment app by investing heavily in the strength of its infrastructure, building connections with partner banks, and developing a huge network of merchant acceptance points. Also making their debut are fintech brand Cred (No.48; $2.0bn), photo and video sharing app ShareChat (No.67; $1.33bn) and entertainment platform Star (No.71; $1.30bn).


    2023 is the 10th ranking of India’s most valuable brands, during which time the Top 50 have increased almost fivefold in value, from $69.6bn in 2014 to $339.9bn in 2023. The last decade is a story of strength and resilience: 33 of the brands in the current Top 75 were also in the 2014 ranking. The companies behind India’s most valuable brands have consistently outperformed the key market indices – the SENSEX and the NIFTY50 – with share price growth over 10 years of 99.6% compared with 83.2% and 81.7% respectively.


    Kantar BrandZ Top 10 Most Valuable Indian Brands 2023

    Rank 2023 Brand  Category Brand Value 2023 (US$M)
    1 Tata Consultancy Services Business Technology and Services Platforms 42,969
    2 HDFC Bank Financial Services 33,612
    3 Infosys Business Technology and Services Platforms 24,170
    4 Airtel Telecom Providers 22,517
    5 State Bank of India Financial Services 14,483
    6 ICICI Bank Financial Services 12,976
    7 Asian Paints Paints 12,839
    8 Jio Telecom Providers 11,773
    9 Kotak Mahindra Bank Financial Services 10,332
    10 HCL Tech Business Technology and Services Platforms 9,361


    Said Deepender Rana, Executive Managing Director- South Asia, Insights Division, Kantar: “It has been India’s decade. Our GDP has almost doubled with an 82% growth, while the world GDP has grown at 30%. This delta is even more when it comes to the most valuable Indian brands, which have almost quintupled in value (4.9 times), compared to the most valuable global brands, which have grown by 2.4 times. So Indian brands are significant value creators for our economy. We expect this trend to accelerate in the next decade as Indian brands don’t just thrive in India, but also explore growth overseas in their quest to become true multinational giants. Our IT services brands have already done that, with TCS and Infosys already featuring in the Top 100 Most Valuable Global Brand list. The strongest Indian brands have forged powerful connections by consistently adding value to people’s lives, and consumers see them as different to their rivals in ways that really matter. Brands must keep investing in building equity to create future demand, even as they capture existing demand which requires a better balance between short- and long-term strategy.”


    Added Soumya Mohanty, Managing Director & Chief Client Officer- South Asia, Insights Division, Kantar: “There is great diversity within the India Top 75: they are a combination of established names and dynamic young brands, both global and local in footprint. What they have in common is their ability to be essentially Indian. Through a deep and detailed understanding of consumers in the market, and adopting the local culture and ethos, even huge international brands are seen and cherished as ‘homegrown’. The trust and loyalty this engenders has helped Indian brands to suffer less and recover more quickly from the storms that have buffeted them over the past 10 years.”


    Other key highlights from the Kantar BrandZ Most Valuable Indian Brands report include:

    :: Sustainability credentials have a major influence on consumer decision-making – almost 9% of Indian brands’ Demand Power – a Kantar BrandZ measure of the ability to drive predisposition to buy – comes from perceptions around sustainability. However, only 8% of brands in India are seen as leaders in this area, compared to 11% globally, indicating an opportunity for those that can do more.

    :: Differentiation is key to commanding Pricing Power – the ability to justify price charged. Brands that have grown in both Demand Power and Pricing Power over the last year did so by being Meaningfully Different. There are different routes to being perceived as differentiated: a brand could be seen as distinct, to be a specialist, or to have purpose.

    :: The strength of the domestic economy has acted like a shield – Overseas contribution for the Top 30 Indian brands accounts for 31% of brand value, compared with 47% for Japan, 59% for the UK, and 85% for France. This has protected the ranking from the worst effects of international volatility.


    The Kantar BrandZ Most Valuable Indian Brands ranking, report and extensive analysis are available now at www.kantar.com/campaigns/brandz/india