Category: RESEARCH

  • Scanning the Indian Pay TV Market


    By Indrani Sen

    Indrani SenIndian Pay TV market is highly fragmented due to the multi-lingual distribution of TV content through many regional distributors along with national distributors covering the HSM and all major regional markets. As per different available research, 50% + share of the subscribers of Pay TV are currently being held by several small regional players. None of the available estimates except the FICCI EY reports takes into account the subscribers of DD Free Dish while estimating the total TV households in India. DD Free Dish subscribers do not have to pay for the TV content so do not contribute to the pay TV market revenue.

    Media Partners Asia (MPA) has recently published a report titled “Indian Pay TV Distribution 2021” which predicts that by 2025, the Indian Pay TV industry will reach revenue of USD 12.3 billion and total Pay TV subscribers will increase to 134 million in 2025 from 127 million in 2020. According to the same research, DTH homes in India will grow from 58 million in 2020 to 68 million in 2025 at the cost of the cable TV homes during the same period. Compared to estimates published by various other research organisations, the total pay TV subscribers’ base in India seem to have been underestimated while the revenue may have been overestimated by MPA.

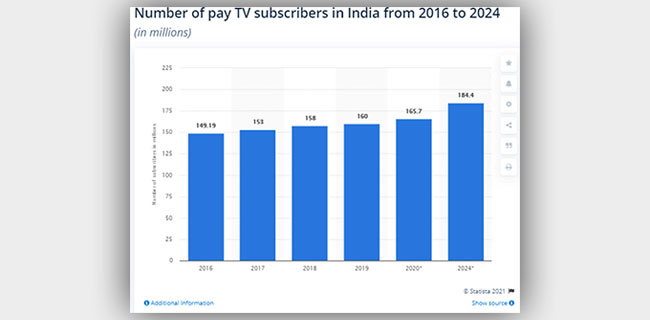
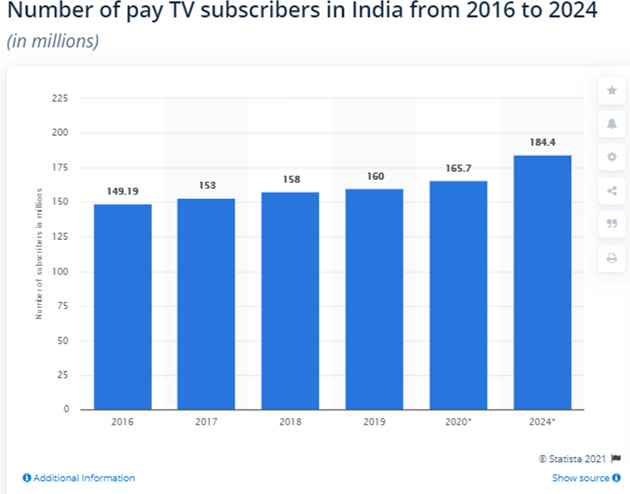
    According to an estimate published by Statista Research Department on March 19, 2021, “India had over 160 million subscribers of pay TV in the year 2019. This figure was around 149 million subscribers in 2016 and was estimated to go up to over 184 million Pay TV subscribers by 2024.” These estimates are higher than the estimates made by the FICCI EY in their report on the Indian M&E industry 2020.

    Another report India Telecom Operators Country Intelligence report published by www.globaldata.com in 2020 supports the estimates of Statista. As per this report, Cable will be the leading Pay TV technology in India throughout the forecast period, followed by DTH with a small presence IPTV which is expected to grow in India at a very fast rate during the next 4 years. As per www.globaldata.com the total Pay TV revenue in India is expected to grow at an annual growth rate (CAGR) of 0.7 percent from USD 3.19 billion in 2020 to USD 3.30 billion in 2025, which is much lower than the FICCI EY estimates.

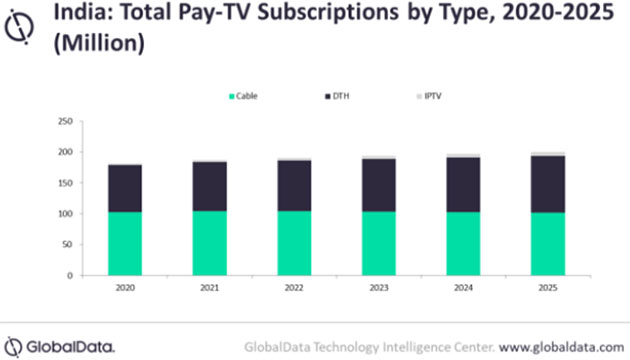
    The above picture reflects the trends in TV distribution by technology in the global market, though the pandemic has reduced the share of the cable TV subscribers in India. IPTV is expected to grow at a CAGR of 19.4% in India during the next 4 years riding on the fixed broadband penetration in India as well as smart TV sets.

    According to the report published in www.grandviewresearch.com: “The global Pay TV market size was valued at USD 225.9 billion in 2019, registering a CAGR of more than 1.5% from 2020 to 2027.” This report spoke about the growth in penetration of Pay TV in rural households in China, India and Indonesia creating overall growth in the Pay TV industry.


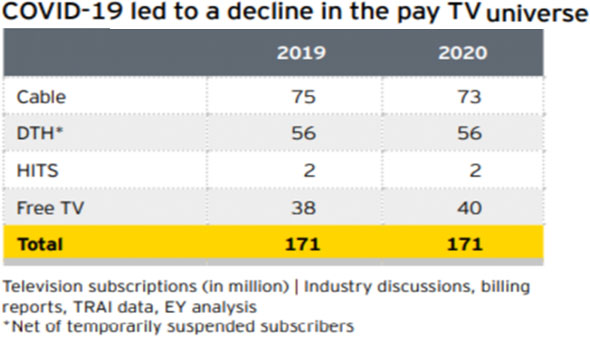
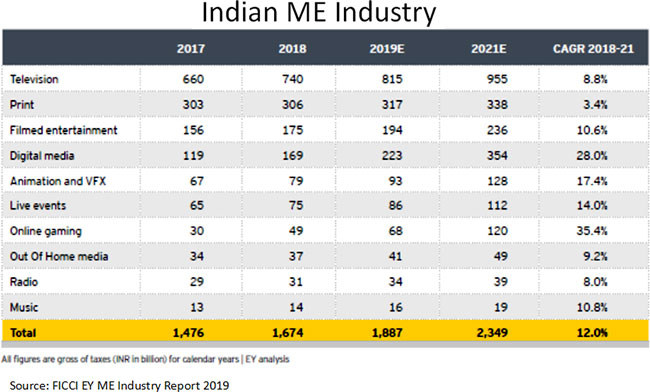
    Source: FICCI EY Indian M&E Industry Report 2020

    As per the FICCI EY report on the Indian M&E industry 2020, there are 171 million TV households in India of which 40 million are Free TV households. The report estimates distribution revenue of the Indian TV Industry to reach INR 502 billion (USD 6.72 billion) in 2023 from the current level of INR 434 billion (USD 5.80 billion). The FICCI EY estimates seem to be the best one available currently for the size as well as the revenue of the Pay TV market in India.

  • Advertising goes down 29%


    By Indrani Sen


    Indrani SenThe FICCI EY report on Indian M&E industry 2021 titled “Playing by New Rules” was released last Friday, March 26, 2021 at a virtual event. By now, we know that M&E sector posted INR 1.38 trillion in 2020 (a decline of 24% from 2019). Except Digital Media and Online Gaming, all other media suffered degrowth as an effect of Covid-19. Print media lost its #2 position to Digital Media, while Television managed retain the #1 position.

    Let us turn our focus to the advertising industry, which according to the FICCI EY report, saw the highest single year drop in the history of Indian advertising. The industry saw a degrowth of 29% in 2020, higher than the 24% degrowth of the overall M&E sector. The report describes 2020 as “a watershed year for advertising spends”. A review of how advertising revenue was distributed among different media in 2020 and how did the distribution compare with 2019 is shown in the table below:


    Ad Revenue by Media: Source FICCI EY Report 2021

    Advertising in traditional media experienced a degrowth of 37% from 2019 to 2020, but advertising in digital media remained steady and did not suffer any loss. Advertising in Print sufferred due to reverse migration, changed consumer habits and cost-cutting while advertising in Radio and OOH was affected by reduced mobility of consumers. The experienial industry comprising of Events and Cinema degrew due to lockdown guideline, social distancing norms and consumer fear of crowded places.

    The advertising industry is not expected to recover the losses of last year in next two years (2021 and 2022). While the total advertising spend is expected to regain the pre-Covid-19 levels in 2023, the individual traditional media are estimated to regain the same levels over a period of 5 years: 2021 (none), 2022 (Television), 2023 (Events & Cinema), 2024 (OOH), Radio (2024+) and Print (2025+).  Digital media is expected to grow by 22.5% over the 2019 level in 2021.

    In a Marketer Survey conducted by EY in 2020, 88% of marketers were confident that consumer spends in their sector would grow in 2021. 66% of the marketers felt that their advertising expenditure would grow in next two years. However, 33% of the marketers surveyed felt that their advertising expenditure either would not grow or would decline in the next two years.

    The same survey showed the marketers incresed investments in D2C initiatives during the pandemic in 2020 as shown in the above chart and 74% of them expeted to spend over 20% of their total spends on digital media against 45% who had shown interest in investing in digital media in 2019. A significant increase in digital spend were expressed by most.

    The survey probed further on how the marketers were assessing the state of their future readiness in terms of their digital maturity and found that the advertising agencies are playing a crucial role.

    :: “92% of respondents were actively monitoring their digital readiness, at a time when complex ecosystems are emerging across the business and marketing landscape.

    :: 53% of respondents surveyed depended on their agency partners to update them on leading practices in their digital transformation journeys”

    The FICCI EY report finally sums up the section on advertising by listing how advertisers are turning uncertainty to opportunity through Martech adoption, investments in brand purpose and architecture, hyperlocalisation, building and retaining immersive consumer experience, diversification of media, colaboration and last but not the least ensuring digital effectiveness. The experts’ comments at the end of the section on Advertising makes it clear that in the digital age advertising agencies need to invest in data, technology and analytics to stay relevant for their clients.


  • So how do the GroupM & Madison forecasts compare?


    By Indrani Sen


    Like every year, last week we saw the release of both This Year Next Year 2021 (TYNY2021) by GroupM and Pitch Madison Advertising Report 2021 (PMAR2021) by Madison Media. Both agreed that the pandemic year 2020 was a disastrous one for the Indian Media and Advertising Industry, when the overall AdEx dropped by 20% (PMAR2021) to 21.5% (TYNY2021) from the 2019 level. Both have predicted better days in 2021 with the overall AdEx growing by 23.3% (TYNY2021) to 26% (PMAR2021).  According to PMAR2021, the predicted AdEx INR 68,325 crore in 2021 will touch the AdEx INR 67,603 crore in 2019. According to TYNY2021, the forecast for 2021 is INR 80,123 crore, which falls short by 3.35% from the AdEx in 2019 which was INR 82,904 crore.


    In spite of the huge gap in the overall AdEx estimates by the two agencies, it is relieving to find that the trends predicted by both of them are similar. The gap in the estimated size of the Indian AdEx between the two reports has been existing over many years and the Media and Advertising Industry has learned to live with the differences. TYNY2021 has estimated both TV and Digital AdEx at much higher levels than PMAR2021. On the other hand, PMAR2021 has estimated Print AdEx at a much higher level than TYNY2021. The following two tables show the details of the two reports by medium for making easy comparisons.


    According to PMAR2021, the pandemic year 2020 will go down in the history of Indian Media and Advertising as the year when Digital overtook Print and became #2 in terms of market share of overall AdEx. However, TYNY2019 showed Digital as the #2 and Print in the #3 positions in terms of market share. In 2020, GroupM estimated a 2% degrowth in Digital from 2019 level, while Madison Media estimated a 10% growth in Digital over 2019 level. Both the reports show Print AdEx in 2021 would be below the 2019 levels, while Digital AdEx would be crossing the 2019 levels in 2021. So, we can now conclude that Digital has the second highest market share in overall AdEx and it is unlikely that Print would be able to regain that position in 2021 or later.


    TV which holds the #1 position in Indian AdEx in both the reports, had degrowth of 11% (PMAR2021) to 14% (TYNY2021) last year, but is expected to grow at higher rate 17% (PMAR2021) to 18% (TYNY2021) in 2021 and touch or cross the 2019 AdEx levels.


    Both the reports show the huge loss which was suffered by the other traditional media, Outdoor, Radio and Cinema during 2020.  In spite of the overall growth of AdEx predicted for 2021, these three media would be far below their 2019 benchmarks. The combined market share of these three media continues to be less than 10% in both the reports. A difference in reporting between TYNY and PMAR has been noticed this year regarding Radio. While PMAR2021 has reported only on Radio, TYNY2021 has changed the nomenclature to Audio. It is however not very clear what other audio component apart from Radio has been included under that definition.


    It is encouraging to find from the two reports that the worst effect of pandemic is over; Media and Advertising industry is on the path of recovery; the process of digitisation has been accelerated; we are expecting a robust GDP growth and globally India will continue to be the second-fastest growing AdEx market among the top ten countries in 2021. At the same time, it is also frightening that the economic effects of Covid-19 have manged to wipe off two years of overall AdEx growth (2020 & 2021) and many media-owners and some media agencies still have to fight battles for survival.


  • Is Legacy Media Recovering in the Unlocking?


    By Indrani Sen


    During the last two or three weeks, we saw many reports on how the AdEx has improved in June 2020 ensuring us that not only digital, but TV and print are also on the path of recovery after Covid-19. TAM AdEx for June has shown that TV advertising volumes increased by 74 per cent per day in June compared to April, when adspends declined sharply due to decline in demand during the nationwide lockdown. TV ad volumes saw 46% growth in June compared to May.


    Print, which suffered a bigger hit in terms of revenue due to distribution problems during lockdown, has recorded a higher increase of 325% in average ad volume per day in June 2020 when compared to April 2020. Most of the business newspapers and industry websites reported on the recovery of digital and TV media. None of the articles highlighted the comparison between the first quarter and the second quarter of 2020 which could have given a better idea about the recovery of ad volumes in digital and TV media.


    I saw only one article in details on Print AdEx on the recovery of Print AdEx which also did not have any such comparison (https://www.financialexpress.com/brandwagon/print-advertising-on-the-road-to-recovery-as-average-ad-volumes-per-day-rose-325-in-june-2020-tam-adex/2032701/). This trend of lack of reporting on print clearly indicates that the medium has lost its position to digital not just in terms of share of the advertising pie, but also in the share of mind map of the audience, the advertisers and agencies.


    The Advertising Report on Radio – April-June 2020 published by TAM shows that average ad volume per day increased by more than two-fold in June compared to April and May. However, a comparison with the first quarter of the year (Jan-March) shows that the ad volumes in radio are still much below the pre-Covid-19 phase. It is interesting to note that FM Radio ad volumes in Non-metro cities have recovered better than metro cities.


    The ad volumes of radio advertising in all 18 cities grew in June 2020 over May 2020. The chat below shows that the eight non-metro cities, Nagpur, Indore, Vizag, Kanpur, Hyderabad, Lucknow, Vadodara and Ahmedabad have shown much better growth in June 2020 compared the four metro cities. Kanpur, Indore and Vizag led the chart with each accounting for two-fold growth in ad volumes. Among the four metro cities, Kolkata has shown the highest percentage change in June 2020 over May 2020 with Mumbai showing the least percentage change. The listenership of FM radio increased during the period of lockdown and has retained the level, but advertisers across different cities are investing in the medium in different way.


    The report has detail analysis of radio advertising by categories, advertisers and brands as well as city wise analysis of the performance of radio AdEx. It also presents comparative analysis of TV and radio and digital and radio advertising during Jan-June 2020. The Top 10 common categories, advertisers and brands between TV and radio shows that during the first six months of 2020, Top 10 common categories, advertisers and brands added 33%, 14% and 4% on TV while they added 10%, 7% and 4% on radio.  Similarly, the Top 10 common categories, advertisers and brands between digital and radio shows that during the first six months of 2020, Top 10 common categories, advertisers and brands added 47%, 18% and 12% on digital while they added 19%, 2% and 1% on radio. The role of radio in the media mix needs to be reassessed by advertisers and agencies for the growth and survival of the FM radio industry during this period of unlocking and subsequent return to normalcy.


  • Rise & Shine of the Digital Duo


    By Indrani Sen


    The digital marketing trends in US indicate the trends across the world (except China). Recently, an article in www.emarketer.com indicated that the Facebook-Google duopoly will continue in the US market in spite of the amazing growth registered by Amazon which has been steadily increasing its share (https://www.emarketer.com/content/facebook-google-duopoly-won-t-crack-this-year?ecid=NL1009). Google is the leading partner in this duopoly across the world.


    The same duopoly enjoys together 68 per cent of India’s digital ad market and it is likely to grow as the digital advertising spending is expected to also increase by 30 per cent in 2019. Even if the growth forecast takes a dip as foretold by the less than expected yield of digital media during Diwali 2019, it will not affect the stronghold of the duopoly.


    Google India, the arm of the technology giant, reported total revenue close to ₹ 9337 crores in FY18.  A most unprecedented financial result reported by Google India for FY19 has created confusion in the market place. Google India reported a 56 per cent fall in revenue to ₹ 4147 crores in the year ended March 31, 2019 (https://www.statista.com/statistics/717633/google-revenue-value-india/). The fall was attributed to a new accounting standard introduced by the Ministry of Corporate Affairs, Government of India.


    Google is the undisputed leader in India’s mobile search engine market, but its biggest cash cow- Google AdWords, is registered under the Google Asia Pacific division. As such, the revenue and profits from AdWords cannot be filed as part of the Indian division without incurring certain burden of taxation as per the amended rules. So, advertising revenue, the biggest contributor to Google’s  overall revenue is missing from the revenue posted by Google India.


    On the other hand, Facebook Inc’s Indian operation has reported revenues of ₹ 892 crore, compared to revenues of ₹ 521 crore, a 71% jump in revenues last fiscal for fiscal year ended 31 March 2019  (https://economictimes.indiatimes.com/markets/stocks/earnings/facebook-reports-84-jump-in-net-profit-for-india-at-rs-105-crore-for-fiscal-2019/articleshow/71891826.cms?from=mdr) As a result, share of Facebook has gone up in the duopoly in Indian market, though it has a long way to go before its revenue gets closer to Google’s revenue. It remains to be seen if Amazon will be able to grow its share in the Indian market following the US example.


    As advertisers and agencies continue to use Google AdWords and place digital advertising through Google, the analysis of the revenue sources will not match with the money spend on digital advertising across various platforms offered by Google and will add to the computing confusions in media planning.


  • IRS 2019: Future of Print under Microscope


    By Indrani Sen


    Indrani Sen

    The recent release of IRS 2019 by the MRUC did not have as dramatic impact as the release of IRS 2017 when the definition of readership was changed from “Average Issue Readership” (AR) to Total Readership” (TR). Yes, the TR has gone up by 2.7 crore from 40.7 crore to 42.5 crore with both newspapers and magazines contributing to the raise the numbers, but if we try to read between the information in the carefully drafted PPT released by MRUC for consumption of Industry at large, we find some red flags concealed in certain corners.

    Let us look at the slide on all media consumption highlighting the growth of internet. Internet accessed has grown by 5% from IRS 2017 to IRS’19Q1. No other medium has shown this kind of growth. While total readers have increased to 42.5 crore, the internet users are now 384 million, or 38.4 crore. With increase of another 5 to 6 million internet users, soon the internet penetration will be same as penetration of print on All India basis. Print media needs to plan for their digital strategy asap in order to survive.

    The NCCS distribution going flat is a clear indication that MRUC needs to rework the definitions based on ownership of durables. The PPT has put in a flag in couple of slides saying “Need for a sharper socio economic discriminator?” No timeline for a working plan was indicated at the launch event.

    In this connection, I would like to mention that my students at SIMC did a survey last year on media habits of non-teaching staff working in all Institutes of Lavale campus of Symbiosis, Pune. They found that the need of giving good education to their students and the availability of easy EMI have made 90% of ‘bhaiyas’ and ‘mausis’ with their children in secondary schools have made them purchase either desktop or laptop computers for their use at home. I have been commenting on this need for a change in NCCS for some time. I am happy to see that MRUC has acknowledged it this time in their PPT on IRS 2019.

    Finally, I would like to comment that print players need to respect the findings of IRS 2019. MRUC should get a continuous flow of funds from them, so that no disruptions occur in the field work like it happened after the release of IRS 2017.


  • Online Gaming is the new Digital Rock Star


    By Indrani Sen


    Indrani Sen

    The digital gaming industry in India is currently undergoing rapid changes riding on the mobile revolution and fuelled by investment from big players such as Alibaba, Tencent, Youzu and Nazara. Many startup gaming developers are also lapping up the opportunities and providing the online gamers with new formats of online games and real-time experiences. Industry experts estimate that the number of online game developers has grown 10 times in last eight years from a mere 25 in 2010 to around 250 in 2018.


    A decade back, the accessibility to playing online games was not easy as it required downloading and installation of games on consoles and desktop computers. The rising affordability and adoption of smartphone has become one of the important factors contributing to the rise in the number of gamers and success of the online gaming Industry. The new age gaming developers are experimenting with innovative gaming formats backed by blockchain, artificial intelligence and machine learning technology. Action, adventure and puzzle are the popular gaming genres in India with fantasy sports rising at a fast rate supported by emergence of new sports leagues as well as promotion of traditional sports tournaments through online gaming.


    As per the FICCI-EY 2019 report on Indian M&E Industry, the industry growth was from 2017 to 2018 was led by online gaming and digital media as shown in the following chart.


    Source: FICCI EY ME Industry Report 2019


    The report further predicts that online gaming will have the highest CAGR (35%) from 2018-2021 and along with the digital media (28%) and in three years both sectors will more than double their value in INR. While digital media is tipped off to overtake filmed entertainment 2019 and print in 2021, online gaming is already bigger than OOH, radio and music and will overtake live events in 2021 and is likely to overtake Animation and VFX by 2022 to rise to the fifth rank in terms of the share of the Indian ME industry pie.


    Indian ME Industry Source: FICCI EY ME Industry Report 2019


    This trend is going to have a far-reaching impact on the effectiveness and efficiency of the digital media planning which is expected to ride largely on programmatic buying and planning. Many advertisers would like to try out the route of developing exclusive/ branded online games targeted at their audience profile. The Freemium business model, which is currently most commonly used model in the online gaming sector in India, will attract more support from advertisers. Digital Marketing and Media Agencies will explore more innovative ways of exploiting the scope of reach provided by online gaming. After mobile and social media, online gaming will develop as a distinct media channel in the next decade. Online gaming is going to be the new rock star of all online media from 2020.


  • Cricket nets 87% share of Indian Sports Sponsorship


    By Our Staff


    GroupM ESP, the entertainment, esports and sports division of GroupM India has released the sports sponsorship report for India 2020. The size of the Indian sports industry in 2020 is estimated at Rs 5894 crore. This report takes into consideration – sponsorship spends, celebrity endorsement and media spends on sports properties.


    The biggest share here goes to media, where advertisement spends on TV, Digital and Print media contributed to Rs 3657 Crore, which accounts for 62% of the total spends. Sponsorship Spends included On-Ground Sponsorships, Team Sponsorships and Franchise Fee, and this took up 28% of the industry pie, which translates to an amount of Rs 1673 Crore. An interesting shift that gained momentum in 2020 was the athlete endorsement which grew 5% over 2019, against the run of play in a year ravaged by the pandemic.


    During the period of inactivity in sports, there was a significant step jump in the level of social media influencer activity among popular athletes. Here again, cricketers ruled the roost, with a 92% share of the pie. Of the 377 endorsement deals that happened last year, 275 involved cricket players. 2020 also saw female athletes pulling in brands and the continued success of these stars is proof of the fact that our champions are loved, and we are proud of them. As the sporting nations wait eagerly in anticipation, the stocks are highly in favour of endorsements from our athletes.


    The lockdown had also catalysed the growth in certain sectors. The absence of live sports along with a sub-optimal supply of fresh OTT content led to the shift towards gaming; the month of April 2020 saw an 11% increase in users per week along with a significant jump in average time spent per gamer. This led to a sudden boom in e-sports in 2020, with communities getting built and multiplayer activities gaining ground. Over the last three years, there has been a doubling in the gamer base as well as viewership numbers in the time.


    Despite Covid-19 threat and multiple risks, India’s foremost sporting league, the Indian Premier League (IPL) got underway in UAE in September much to the delight of fans, players, franchisees, sponsors, and rights holders. The success of the IPL was a great demonstration of the qualities of brinkmanship and improvisation, just what the doctor ordered to lift the spirits of a nation in which cricket is followed with religious fervour. Even as the absence of a fair share of events has rendered year-on-year comparisons irrelevant, two things are extremely heartening. First, the overall levels of business seen in the industry in 2020, and then, the high running momentum as we exit the year and move on to 2021.In November, the Indian Super League (ISL) got underway in three venues in Goa with strict protocols and adherence to bio-bubble considerations. This was the first major sports event to be held in India after the pandemic; giving ample demonstration of our ability to pull off an event of this magnitude under such circumstances.


    Said Prasanth Kumar, CEO – GroupM South Asia: “With the lockdown being enforced and subsequent stoppage of play on the field, the void was stark with no visibility on how the anti-Covid efforts would pan out. And even without any activities, our sports heroes stayed close to us. They came closer by actively engaging with their followers on social media and the spontaneity of this online content flow and with the open arms that we welcomed it, is the demonstration of the power of sports in our country. Speedy responses and improvisations are on the go where what the situation demanded and among the many things the Covid-19 situation taught us marketers, was the need to be adaptable as the tide turns fast around us.”


    Added Vinit Karnik, Head – Sports, Esports and Entertainment, GroupM South Asia: “Many sports properties were either cancelled or postponed and even sponsorship and media spends were impacted. But it is commendable how the sporting ecosystem reacted to this crisis taking into consideration the very fact that sports were back sooner than expected. Even in the face of an adverse context, the stakeholders came together to provide the spark the industry needed. The IPL and ISL are an exemplary demonstration of India’s preparedness to host major sporting events under such taxing circumstances. With many sporting events lined up in 2021, fans might have to make choices between certain events in terms of what, when and how much to watch, leading to a rise in demand for subscription viewing in live sports. 2020 looks like that proverbial backward step we take before a giant leap, like the one we are expected to take in 2021, as part of the making of the sporting nation.


  • 2 out of 3 news consumers see fake news as a major concern


    By Our Staff


    Media consulting firm Ormax Media has unveiled the results of the second edition of its report titled ‘Fact or Fake?’, which is based on a survey of news consumers, and measures their credibility of various news media, as well as their overall perception towards ‘fake news’.


    This is the second edition of the report, based on data collected in April 2021. The first edition was released on September 2020. The survey covers urban news consumers (15+ yrs.) from 17 states and Union Territories in India.


    According to the report, only 35% news consumers feel that the news category in India doesn’t have any major fake news concerns. This number has dropped 4 percentage points, from an already-low level of 39% last year (Sep 2020). This implies that 65% news consumers, i.e., almost 2 out of 3, see fake news as a major concern.


    Print media continues to lead on credibility, with a score of 62%, the same as the last track. Radio holds on to its no. 2 position (56% now, vs. 57% in 2020). However, all other media have shown minor or major drops, i.e., Television (56% to 53%), Digital news apps & websites (42% to 37%), Social media (32% to 27%) and Messenger apps (29% to 24%).


    Within social media, despite a drop since the last track, Twitter continues to rank on top with a News Credibility Index of 47%. No other social media or messenger app platform manages to touch even the 30% mark. Newly-launched Koo scores only 24% on credibility.


    Commenting on the report and its findings, Shailesh Kapoor, Founder & CEO – Ormax Media said: “Concerns around fake news have been escalating worldwide over the last few years. But a drop from an already-low score of 39% to 35% within just seven months, does not augur well for the Indian news industry. In the midst of a pandemic, credibility of news becomes even more important. We hope to see television news and digital platforms address this concern more proactively, before it becomes a brand safety issue for advertisers using these media, and a cause for rejection for subscribers of paid news services”.


    News Credibility Index and Media Credibility Index are a % of news consumers who don’t see fake news as a major concern and news consumers who find the news in a particular medium generally credible, respectively. All credibility scores are among consumers of that particular medium or platform.


    News Credibility Index (Apr 2021 vs. Sep 2020)


    Media Credibility Index


    Media Credibility Index: Social Media & Messenger Apps

  • Alcohol adspend to beat market with 5.3% growth in 2021 as hospitality opens up

    By Our Staff


    The Zenith’s Business Intelligence – Alcohol: Beer + Spirits has published its report. Alcohol adspend to rise from US$6.7bn in 2020 to US$7.7bn in 2023. Alcohol brands spend twice as much on television as the average brand, but will reduce their spending by 2.4% a year as audiences continue to shrink. Spirits brands have pivoted rapidly to owned online content, to help consumers replicate the brand experience – normally the main driver of sales growth – at home


    According to the report, digital advertising to account for 30% of alcohol adspend in 2023, up from 21% in 2019. Alcohol adspend in 12 key markets will grow by 5.3% in 2021, ahead of the 4.9% growth of the ad market as a whole, as brands recover from a much steeper drop in 2020. Alcohol advertising will then grow roughly in line with the market, with 4%-5% annual growth in 2022 and 2023.


    The pandemic has forced the alcohol brand experience to move online.


    Said Ben Lukawski, Global Chief Strategy Officer, Zenith: “Spirit brands have surpassed beer brands in terms of sales value by offering more premium experiences and rituals around their product and serve,” “With the pandemic taking audiences away from the on-trade we have seen a greater emphasis on bringing these premium experiences in home through owned digital content.”


    Consumers are now much more aware of the available options for buying alcohol online, and alcohol brands now have distribution networks in place to supply them. Zenith expects brands to expand their digital advertising to support alcohol ecommerce even after pubs and restaurants are fully open, fuelling 9.2% annual growth in digital adspend between 2019 and 2023, when digital advertising will account for 30% of alcohol advertising budgets.


    Zenith predicts alcohol brands will reduce their expenditure on television by 2.4% a year to 2023, compared to the 2019 baseline, as traditional broadcast audiences continue to shrink. Out-of-home advertising, by contrast, will grow by 1.1% a year, even taking into account the pandemic-induced reduction in foot and road traffic. Television’s declining reach makes out-of-home’s ubiquity even more valuable.


    Alcohol advertising to recover from 2020 decline by 2023


    Alcohol advertising shrank nearly twice as fast as the overall ad market in 2020, falling by 11.6% compared to 6.4% of the market as a whole, Brand finances were squeezed by reductions in consumption volume, the average price per drink, and profit margins. With bars, pubs and restaurants closed, consumers drank less alcohol, and bought the drinks they did consume from shops where they cost less, with a much lower mark-up. Brands cut back their marketing sharply to protect their bottom lines, and their combined adspend fell from US$7.6bn in 2019 to US$6.7bn in 2020.


  • 900m internet users by 2025!


    By Our Staff


    According to IAMAI Kantar ICUBE 2020 Report, India is likely to have 900 million active Internet users by 2025 as against around 622 million as of 2020, registering a growth of about 45% in the next five years.


    The report suggests that even though the Internet penetration in urban is more than 2X that of rural, usership in rural has been growing at a faster rate on a year-on-year basis. While internet users grew by 4% in urban India — reaching 323 million users (67% of urban population) in 2020, digital adoption continues to be propelled by rural India – clocking a 13% growth to 299 million internet users (31% of rural population) over the past year.


    This indicates that there’s a lot of headroom for growth in rural India and this would help in bridging the urban-rural digital divide. However, the growth rate of AIU (those who have accessed internet in the last one month) has progressively reduced over the years and is the lowest in the last four years.


    It also finds that nine out of ten active internet users access the internet every day; On average, they spend around 107 minutes (1.8 hours) actively on the internet daily. Though the proportion of daily users is marginally higher in urban India as compared to rural India, AIU in urban India is spending 17% more time as compared to rural India.


    Said Biswapriya Bhattacharjee, Executive Vice President, Insights Division, Kantar: “By 2025, there would be a greater number of internet users in rural India than in urban India. Given this, the digital ecosystem will need to evolve to address the specific needs of this emerging demography. Vernacular, Voice and Video will emerge as the game changers for the digital ecosystem over the next few years.


    Small towns account for almost two out of five active internet users while the top 9 metros account to 33% of the active internet users in urban India. The report suggests, of 1433 million population in India, 622 million individuals are AIU and this translates to about 43% of the total population (across urban and rural India). However, with a sizable population not accessing the internet actively in rural India, there is huge headroom for growth in the next few years.


    Interestingly, the proportion of male to female AIU remains almost the same in rural and urban India. In urban India, the ratio between male to female Internet users is around 57:43 while in rural India, the ratio between male to female Internet users is 58:42.


    Mobile continues to remain the device of choice for accessing the internet in both urban and rural. Given the affordability of mobile devices along with the availability of cheaper data plans, accessing the Internet through a mobile device has clearly become the first choice, finds the report.


    Digital Services have assumed great importance for India with the government actively promoting a vision of $1 Tn digital economy. Also, Internet has become a lifeline to most of us amid the Covid-19 pandemic. Almost every decision achieves fruition with the able interference and assistance of the internet. Coronavirus has made us acutely realize the importance of the internet. The internet helped businesses tide through the tough lockdowns, individuals connected with each other, used the opportunity to learn and acquire new skills, and provided much-needed meaning and reason to carry on.


    The spread of the internet has been possible thanks to the joint efforts by the government (promoting e-governance, Digital India vision), telecom services providers (more affordable data packages, better connectivity), and Internet Service providers (popular services like digital entertainment and e-commerce, expanding content in Indian languages). IAMAI stated that the ongoing growth of internet penetration in India provides a critical platform for all stakeholders to harness the digital revolution. The pandemic has also fueled the growth. The association expressed optimism that the government’s policies, regulations, and industry’s support will further strengthen the digital footprint in India and ensure a robust digital economy in the country.


  • The More The Merrier


    By Our Staff


    Amdocs, provider of software and services to communications and media companies, has released the findings of its latest Streamer 2021 Report, which surveyed 1,000 consumers in India about their preferences around streaming and subscription services. The data revealed high levels of interest by Indian customers in a mega bundle comprising of content and communications services.


    According to the findings, 76% of all surveyed consumers expect to add to their current subscriptions with the most likely being video streaming services, wellness and e-Health, and eLearning services. Consumers have explored the vast array of content and services available to them, discovering that there are plenty of offerings which stretch beyond the satellite/cable and video streaming status-quo.


    Change in consumption habits: When asked how their live and on-demand consumption habits are set to change, compared to the last 12 months, over two thirds (69%) of consumers expect the overall time they spend on this to increase in the next 6 months from the current average of 14 hours per week.


    Customers are showing high levels of interest in a mega bundle comprising of content and communication services: The next generation of bundles will still allow consumers to control key aspects such as subscription management, and user settings will be controlled centrally for an added level of privacy. When thinking about the different types of bundles that would attract consumers, just under four fifths of respondents (79%) would be interested in a bundle of video streaming, entertainment, and communication services, followed by multiple video streaming services (73%), video streaming and communication services (72%).


    Said Raman Abrol, GM & Chief Commercial Officer, Amdocs Media: “The pandemic has led to an increased consumption of media and entertainment services. Availability of multiple streaming options under one roof has resonated well with the comfort levels of consumers who are confined at home and lookout for new means of entertainment. As we know that customer is the king, this is an exciting opportunity for service providers to give customers the option to bundle their services where they can access all their media and entertainment subscriptions in one place. Moreover, our research states that consumers prefer quality of content over pricing – which gives us an overview of how important bundling has become today.”