Category: RESEARCH

  • Is Brand Indigo still ‘6E’?


    By Avik Chattopadhyay


    Avik Chattopadhyay

    What happened with the Indigo passenger is the symptom of a disease that lies deep down. Just like an internal infection manifests itself as a bad cough or a painful boil. That disease is an outcome of serious neglect and denial…like most diseases. In this case, it is the denial of operating in the service industry, wherein each employee has to have patience, empathy and politeness ingrained into the blood flow through training and mentorship. Obviously, all this is lacking in the Indigo training and resource development system. They just teach processes and nothing more. The “ladies and gentlemen, boys and girls” is mere lip service and does not come out of any deep down customer intimacy.


    While this one incident will make Indigo the brunt of lots of WhatsApp jokes and memes for some time, till the next such blunder by any airline, the management should see this as a clear warning of how they train, prepare and nurture their employees. Personally, I prefer Air India any day…they are polite, understanding and definitely far more patient with all those that fly the airline.


    Brand Indigo is definitely negatively impacted by this incident. The once poster boy of the industry has been losing its sheen over the last couple of years while competition has been upping its service levels and operational efficiency.


    For a service business, the brand is built through every point of customer interface and experience. The once “wow” factors that defined the Indigo brand as a leader are now tablestakes. The innovation has stopped, the flight delays have started, the prices are no longer value and the menu remains the same. How boring is that!!??


    The advertising that once was a reinforcement of on ground brand experiences is now just gimmicky…playing with words. This incident is symptomatic of all that ails the brand now. It is an overt expression of the internal stresses and anxiety. These internal factors do seep into the psyche of all employees. This employee just gave vent to the tensions within the system.


    As my brand guru Wally Olins used to repeat, the brand is a promise of an experience delivered consistently over time. Once that chain breaks, one needs to start afresh…repairs typically are not known to work. More than the incident, Indigo’s reaction, response and redressal system, or lack of it, exposes the disease within.


    Avik Chattopadhyay, co-founder of brand strategy firm Expereal, was until a couple of years back marketing head at Volkswagen India. He has also been India CEO of Saffron Brand Consultants. Hecan be reached at avik@exper.in. The views expressed here are his own


  • Small Businesses Need Data Not Big Data


    By Sanjeev Kotnala


    ‘Big Data’ and ‘Data Analytics’ is everywhere. It is the current buzzword, just like Machine Learning, Artificial Intelligence and BlockChain. It seems unless you are not working with Big Data, you are not in business. However, not every organisation has the capability, resources or a mindset to walk the Big Data and Data Analytics road. Then what do they do?

    It reminds me of a question in IIM Ahmedabad first year. The problem was simple. How many Puri Bhaji packets must the vendor in Platform-II at Ahmedabad railway station make? He should neither waste and nor miss an opportunity to sell. It has sheets of probability tables of trains arriving, on time, probability of trains being late,  number of passengers alighting, passengers going to Ahmedabad, transit passangers, the likelihood of passengers being hungry and ordering Poori Bhaaij. Now that was real Big Data in 1985.

    We all had varied answer ranging from 28 to 169 packets. And we had our logic and rationale for the process we adapted to get to the solution.

    I asked this question to a business owner client of mine. His answer was straightforward. He said ‘forget the consultants and the data you are talking about.  If the vendor is enterprising, he will observe other vendors for two days, maybe err for the next 2-3 days. But, by Day 7, he will have his algorithm of deciding how many Poori Bhaaji packets to make.


    SMALL BUSINESS WITH CHALAK MALAK.

    I have the fortune of interacting with Chalak Malak, highly engaged owner of small- to medium-sized businesses. They are not capturing Big Data. Yet, they have all the relevant patterns at their fingertips.

    The Chalak Malak’s insight is based on his observations and an uncanny ability to connects the dots. The level of understanding is unbelievable. And, yes, most of these observations are ratified and endorsed by the excel-PowerPoint spewing MBAs and researchers in the company. These owners are not seeking data supported confidence.

    These owners work purely on observations. Their interactions with sales and market are their most valuable data point. At time hugely disjointed data. They do not encourage the interlinking of a multitude of variables. They focus on detailed microdata with limited variables that are essential to predict and control their business.

    They work with data that is easily accessible in the business and informative. Something that the organisation can make sense and understand the use of complex systems. It is just data; some data. Neither Big nor Small. Every data capture, recording and discussion are objective-driven and aiming at actionable insight. There is democratic discussion and ultimately a dictatorial approach which facilitate time-bound decisions and implementation.


    Unstructured Data.

    The Chalak Malaks in these small businesses are happy with such scarce data. They understand business is not all science. There is luck involved. They keep variables that are not in their influence and control outside the preview of discussion. Without Big Data and Data Analytics, they draw upon the predictive and prescriptive impact of their focussed data.

    The individual owners’ unstructured data mining ability is enormous. They can observe and analyse reams of data and come to a conclusion fast.

    They are not the CMOs looking for extension and a case study to create. They understand the need to act. They take the risk of acknowledging that failure is part of the process. They give themselves the time to Pause, reflect, absorb and move on with life.

    There is some sort of a black box in their brain. It uses acquired or genetically downloaded powers to analyse data, draw conclusions, unveil hidden patterns, with an undefined internal algorithm, define market trends and examine overt or covert customer preferences.

    Having made sense of the possibilities, they are only interested in actionable. They are least interested in ‘Gyan’ on background, opportunities, business environment and risk mitigation.

    We may interpret such decisions as gut-feel or biased. However, they are well informed and evaluated choices.


    Big Data Is Understood.

    They know of the existence of Big Data and data analytics. They know it requires a budget, resources allocation and talent for it to be leveraged. However, they understand their organisational culture and talent structure. They feel in the current stage, the internally generated data across minimal but crucial variables is what the business needs!


    Small Data Used In Big Way.

    If not, they are aware of the tools and inputs they could borrow from. They use their eCommerce partner for insights. Google Analytics tells them what the visitors are wanting. Social media acts as a listening post. The blogs and articles are trend analyser. E-mails on skeletally managed customer complaints and appreciation are their warning mechanism on quality and service. The everyday sales and cost reports are their health indicators. Market share is approximation through real groundwork on estimation validated by the sales staff figures. The healthy networked conversation with competitors and well-wishers help business environment understanding. They bank on their grassroots connect and relationship with vendors (mostly non-exclusive) to get early warning signals.


    Hate Grey Areas.

    There are rarely grey areas. They are comfortable in taking a polarised view, And that is more than enough.

    Segmentation is simplified. The consumer is a small, large, medium buyer, a repeat buyer or single user, a customer and/or a user. The data is not micro drilled but most likely aggregated. The regional and religion biases, taste and culture, form a different kind of filters while taking decisions.

    They are more dependent and sensitive to the Velocity; speed at which they can get data and Truth-fullness; how much they can trust the data. They are less concerned about the volume; quantity and size of the sample, And the Variety; depth and width of probe or multiplicity of parameters.


    Change Of Guard. Not Of Approach.

    The new generation taking over is all for robust non-challenged data. However, a few things do not change. Focus on crucial impact variables, eye on ROI, the confidence in gut feeling, willingness to learn and tweak and the speed of action.


  • Virat Kohli stays Most Valuable Celeb: Duff & Phelps


    By A Correspondent


    Consulting major Duff & Phelps has released findings of the fifth edition of its Celebrity Brand Valuation Study 2019: ‘New is Gold’.


    The study provides a ranking of India’s most powerful celebrity brands based on brand values derived from their endorsement contracts.


    Key findings from the report include:

    • Virat Kohli retains the top position for the third consecutive year. His brand value rose by 39% to USD 237.5 million (mn) in 2019.


    • Akshay Kumar jumps to second position with brand value of USD 104.5 mn (a jump of 55.3%).


    • Power couple Ranveer and Deepika claim the third spot with a brand value of USD 93.5 mn each. Deepika retains her most valuable female celebrity status for the second consecutive year whereas Ranveer moves up a spot, to now occupy the same position as Deepika Padukone.


    • Total value of the top 20 celebrity brands stands at USD 1.1 billion, with the top 10 contributing about 75% of the total value.


    Said Aviral Jain, Managing Director, Duff & Phelps: “This year we saw the new generation celebrities make it to the top 20. Apart from the celebrities who were featured in last year’s study, this year, we have Ayushmann Khurrana (Rank 10), Tiger Shroff (Rank 17) and Rohit Sharma (Rank 20) with a cumulative brand value of USD 87.5 mn. The industry saw a wave of new faces and concepts with the effective usage of digital media to capitalise on millennials and Gen Z. Even though brands changed their approach of sticking to established actors by roping in new faces, overall the industry managed to stay on course with the perfect blend of traditional and new. The new pedigree of stars also ventured into investments by emerging as ‘starvestors’ (star investors), thus infusing capital in brands that resonated with their values.”


    Commenting on the changing nature of the endorsement market in India, Varun Gupta, Managing Director and Asia Pacific Leader for Valuation Services, Duff & Phelps added: “This is the dawn of a new era for the media and entertainment sector. The industry has seen experimentation, be it celebrities moving from traditional mainstream endorsements towards investments in brands, the rise of digital format advertising campaigns, or the onset of over-the-top (OTT) stars who are breaking new ground in endorsements. Brands and celebrities have parallelly adopted the path of conscious advertising and filmmaking by choosing uplifting topics and making the narrative less window dressed, an important facet for today’s Gen Y and Gen Z.” Further, the study focuses on the rising trend of OTT since the upgrade of the India’s digital demography. Regional industries created ripples nationally and globally with OTT proving regional content is no longer a desired state, but a prerequisite for today’s consumer. The study also highlights the new tribe of celebrity endorsers who have become digital stars; they actively involve themselves in social causes and promote brands inclined towards fitness, health and wellness.


  • Traditional media grew 6% in 2019. Forecast for 2020: 5.1%: Pitch Madison report


    By A Correspondent


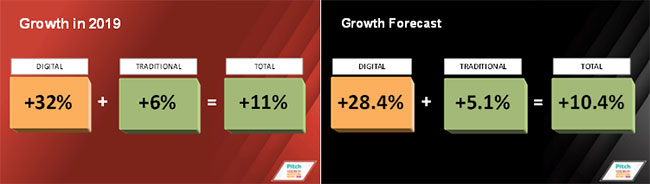
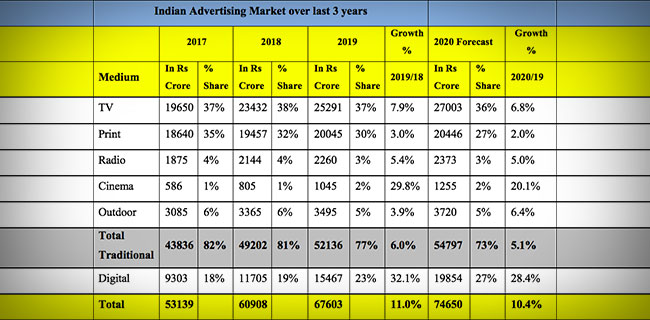
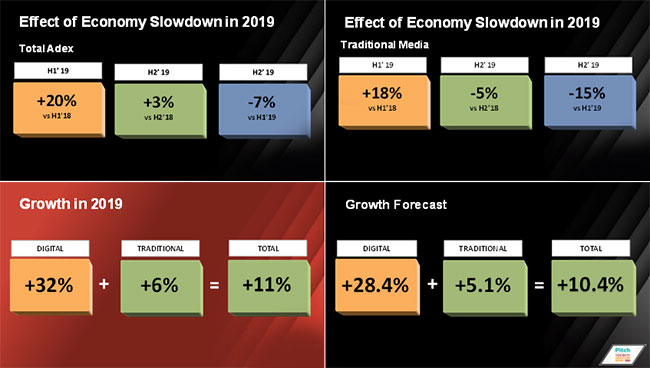
    The annual Pitch Madison Advertising Report 2020 was released on Thursday in Mumbai with the message that didn’t need much spelling out: traditional media grew only 6% in 2019 and actually degrew in the third and further quarter. The forecast for growth in 2020 is down to 5.1%. But digital media is galloping ahead. It grew 32 in 2019, and the forecast for 2020 is 28.4%.


    Said Sam Balsara, Chairman, Madison World: “Whilst 2019 has been a tumultuous year for AdEx, I believe Adex will grow dramatically over the next five years given that we are one of the larger growing economies of the world and already growing at twice the rate of global AdEx (11% vs 5.4%). Despite this India’s contribution to global AdEx is under 2%, which is bound to go up. Advertisers need to experiment more with media and do things differently to harness the power of media for Brands.”


    Key findings of the report:

    A. Overall:

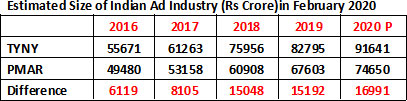
    1) In absolute terms, AdEx has grown from Rs. 60,908 crore to Rs. 67,603 crores, an addition of 6,695 crores or 11%. This makes it the 2ndhighest addition to AdEx in a single year in the entire last decade.

    2) The growth rate of 11% in 2019 is lower than the PMAR mid-year projection of 13.4% and last year’s growth of 15%.

    3) 56% of this growth has been contributed by Digital, which has expectedly grown by as much as 32%.  Traditional media has grown by mere 6%

    4) TV still continues to be the largest contributor to AdEx with 37.4% share, followed by Print at 29.7%, Digital at 22.9%. Outdoor at 5.2%, Radio at 3.3% and Cinema at 1.5%. All mediums except Digital and Cinema have lost share.

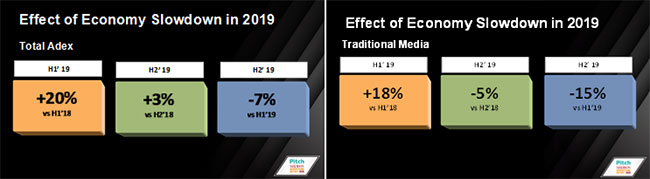
    5) A quarter-wise analysis shows that unlike in most years, when Quarter 4 shows a blip because of the festive season, this year Quarter 2 showed a blip on the back of IPL, World Cup and General Elections and in fact Quarter 3 and Quarter 4 show a de-growth of 3% and 7% respectively.


    B. TV:

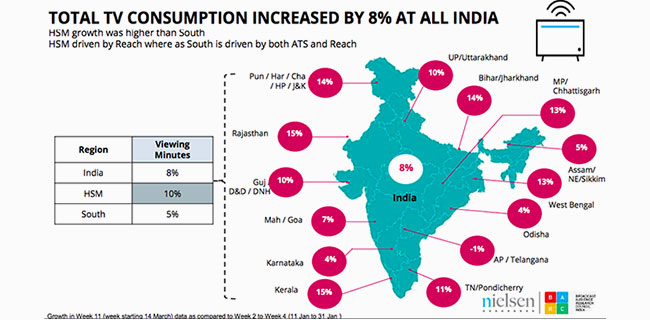
    1) After a rocking 2018 when TV AdEx grew by 19%, TV grew by only 8% in 2019.

    2) TV lost 1% share point and its share in the total AdEx stands at 37%, demonstrating that it is vulnerable.

    3) FMCG continues to rule the roost in TV AdEx, contributing 49% although its contribution came down by 1% share point in 2019. Telecom and Auto follow with 12% and 7% contribution respectively. Ecommerce category also gained dramatically during the year by as much as 20% and has reached Rs. 1,320 crore.

    4) The main categories that have fueled the overall growth of Rs. 1,860 crore in 2019 is FMCG (Rs. 740 crore), Telecom (275 crore) and Ecommerce (Rs. 220 crore). Predictably contribution of the Auto sector to the overall growth is negative in 2019 at -4%.

    5) There is a marginal decline in total FCT that has been telecast in 2019, perhaps because of disappearance of the FTA channels, unlike in most previous years when FCT has gone up year on year.

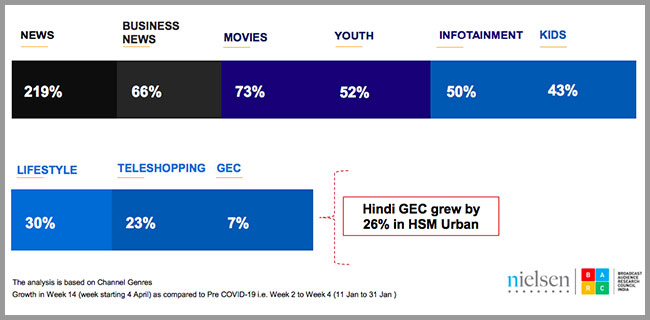
    6) In terms of revenue, Sports genre has grown the highest by as much as 47% and Hindi GEC by about 7%, which leads us to conclude that despite a soft market, these two genres have been able to command a rate increase.


    C. Print

    1) Print grew by 3% in 2019, lower than PMAR’s mid-year projected rate of 5%. Whilst this is the 3rdconsecutive year Print has grown less than 5%, it continues to be the 2nd highest contributor after TV with a share of 30%.

    2) Print share in AdEx has gone down from 42% in 2011 to 30% today.

    3) FMCG, Auto, Education, Real Estate and Retail continue to be the main cash cows and contributed almost 50% to Adex in 2019. Ecommerce is fast emerging as an important category for Print and grew 14%, over 2018. Political Parties are estimated to have contributed Rs. 200 crore on account of  Lok Sabha Elections.

    4) Nearly 65% of Print’s growth of Rs. 588 crore is accounted for by 4 categories – Education, Ecommerce, Real Estate and Retail.

    5) In terms of volume there is a 3% decline in 2019. Hindi publications continue to maintain the lead over English Publications, contributing 35% followed by English at a distant 25%.


    D. Digital

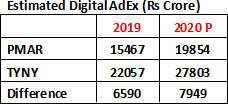
    1) Digital Adex made impressive gains during the year and achieved a growth rate of 32.1% in 2019, the highest growth achieved by any medium in the year taking Digital AdEx to Rs. 15,467 crore.

    2) Digital has grown at a compound annual growth rate of more than 30% over last 5 years and now contributes 23% of AdEx, an increase of 4% share points over last year.

    3) Search, Social, Video & Display have all equally contributed to the growth of Digital AdEx, with each contributing between 20% to 30% to the total.

    4) Consumption of video is going up year on year and in 2019 video spends grew by as much as 59% beating the Digital AdEx growth of 32%. Almost all of Digital AdEx (94%) is on mobile.

    5) 52% of Digital AdEx came from “classical advertising” ie display banners (22%) and online video (30%).

    6) If we were to combine TV+ Online Video, TV growth of 8% would increase to 16%.


    E. Forecast

    1. The PMAR Forecast for 2020 for AdEx is muted. In arriving at the projected growth figure for the whole year at 10.4%, the report is guided by the expectation that the economy should bounce back in the 2ndhalf of 2020 as indicated in the government’s Economic Survey published on January 31, 2020. PMAR therefore sees a subdued H1 for AdEx and a buoyant H2, specially Q4.

    2. We also expect a wide variation of growth rates across mediums with Digital medium leading the growth at 28.4% and ending the year with 27% share of AdEx at Rs. 19,854 to be precise.

    3. TV will continue to be the largest medium with a 36% share of AdEx, but will have a subdued growth rate of 6.8%.

    4. Print will lose 3 percentage points in terms of share of AdEx and end up with a 27% share registering a 2% growth.

    5. Radio and Outdoor are expected to grow at 5% and 6% respectively and maintain their share at 3% and 5%.

    6. Cinema, amongst traditional media should grow at a high growth rate of 20.1% taking its spend to Rs. 1255 crore.


  • Well-Pitched Delivery!


    By Indrani Sen


    As per the Pitch Madison Advertising Report, in 2020 adspends in India are predicted to grow by 10.4%, while GroupM’s This Year Next Year predicts that in 2020 the same will grow by 10.9%. This rate of growth is the only aspect on which both the reports have shown some similarity.

    Even while commenting on the growth rate, GroupM sounded buoyant by comparing it with the 5.1% growth rate of global ad spends in 2020 and ignoring the Indian ground realities while Madison described the growth rate as “muted” expecting the economy to bounce back only in the second half of 2020.

    PMAR 2020 is more firmly rooted in the Indian media and market scenario and has presented an excellent analysis of the ups and downs faced by the traditional media industry in 2019 and its consequences. In his presentation, Sam Balsara made an interesting observation by dividing 2019 in two halves and showing how AdEx grew very well during the first half riding on IPL, World Cup and Lok Sabha Elections, but collapsed during the second half due to economic slowdown. Balsara also showed how the traditional media suffered heavily during the second half of 2019, when compared to second half of 2018, there was a de-growth in second half of 2019.

    Balsara presented  charts showing that the Digital media grew by 32% in 2019 and projected a growth rate of 28.4% in 2020 as against traditional media which grew by 6% in 2019 and is expected to grow by 5.1% in 2020.

    He commented in his presentation that: “We also expect a wide variation of growth rates across mediums ranging from a low of 2% for Press, 5% for Radio, 6% for Outdoor, 7% for TV, to 20% for Cinema and 28% for Digital.” In 2020 TV will continue to enjoy the largest share of the advertising pie at 36% and Print may be demoted to number 3 with Digital securing a march over it. As of now, PMAR predicts 26.6% share for Digital and 27.4% share for Print in 2020. PMAR and TYNY also projects different estimates for the size of the traditional media, with TYNY estimating a value of TV AdEx almost 10000 crore higher than the value estimated by PMAR.

    The growth rates for Digital media estimated by TYNY is 28% in 2019 and 26% in 2020. Both the reports predict Digital as the main growth driver of Indian Adex in 2020, but there is again a significant differences between the estimated sizes of Digital AdEx.

    GroupM has revised their estimate for total AdEx upwards for both 2018 and 2019 while Madison revised their estimate for total AdEx downwards for 2019 due to economic slowdown and various headwinds faced by the traditional media industry. As a result of these revisions made by the two agencies, estimated sizes of Indian Ad Industry by TYNY are now 15000+ crore higher than the sizes estimated by PMAR, a difference which is not only difficult to reconcile, but also creates confusion in the market place.

    By now, we have learned to live with different sizes of the Indian Ad Industry estimated by different agencies. PMAR estimates are most acceptable by the industry at large due to its ability to link the market realities with their statistics supported by analysis of trends in Ad Spends as well as in depth analysis of individual media. Balsara also adds an icing on his presentation every year through advice to advertisers which are considered to be extremely useful and this year he has excelled himself on that score.


    Indrani Sen is a veteran advertising and media agency practitioner. She is now also an academician. Her views here are personal


  • Covid-19 sees TV & Smartphone grow


    By A Correspondent


    Broadcast Audience Research Council (BARC India) went a step further on its attempt to offer a combined measurement of television and digital consumption. TV viewing minutes and Smartphone usage went up 8% and 6.2% respectively as BARC India and Nielsen unveil report on the impact of Covid-19


    BARC and Nielsen put together a report to understand the changes in consumption behaviour of television and smartphones given the extraordinary situation surrounding the COVID pandemic and its fallout.


    Sharing her views on the current surge in smartphone usage, Dolly Jha, Country Leader Nielsen Global Media, South Asia said, “We are living through unprecedented times! Physical Social Distancing seems to have led to a phenomenal growth in Virtual Social Togetherness with an almost 20% increase in time spent per user on Chats, Social Media and News in the last one week. And we anticipate this to grow further.”


    Elaborating on the topic, Sunil Lulla, Chief Executive Officer, BARC India said: “These are unfortunate and unprecedented times. Working closely with Nielsen, we bring for our customers and stake-holders, this very significant and important update, on change in content and advertising consumption behaviour, with a significant population at home. We will report soon enough, the impact of total lockdown. Our respective brave teams are working (WFH) round the clock to ensure the TV measurement currency, continues uninterrupted.”


    Highlights of the report:

    1. The Covid-19 disruption period has seen an increase in television viewership – 6% increase in TV reach and 8% increase in TV viewing minutes /week. The time spent on TV / viewer has seen a jump by 2%. The PM’s address to the nation on complete lockdown on March 24 garnered unprecedented viewership of 197 million watching it across the country.


    2. When we look at smartphone behaviour the time spent on smartphones per user has gone up by 6.2%. The time spent/user/week on VOD apps has also seen an increase of 3%. If we look at the increase in the time spent/user/week over that of the previous week (to take away the impact of Cricket viewing in the PRE COVID period considered), we can see a jump of 5%.


    3. Kids’ schools being shut and the stress of exams off their shoulders has resulted an increase in television viewing (+20%). With corporate India getting into Work from Home mode, NCCS A showed an 11% increase in viewership. Even on smartphone usage, the increase in driven NCCS A (+7.7%) and 35-44-year-olds (+10.7%).


    4. People staying at home led to watching TV throughout the day and hence the growth in TV viewing is coming from Non-Prime Time slots (8am – 5 pm).


    5. The need for continuous updates expectedly has led to a huge increase in news consumption on Television (57% increase in Impressions), while spending more time as a family together could be leading to the Movies genre and the Kids genre also showing significant increases.


    6. This behaviour is seen in digital consumption as well with News and Gaming showing huge increases. News apps saw 8% more users per week with an increase of 17% in time spent/user/week. This growth was led by non-English News apps (+87%). Gaming apps saw an increase of 2% in users/week and with a 11% increase in time spent/user/week.


    7. With a lot of uncertainty around what is happening, people have increased their time spent on Chatting (+23%) and Social Networking (+25%) apps.  Almost all social networking apps –  Facebook, Instagram and TikTok have seen significant increases not only in time spent /user/week but also in the sessions/ user/ week.


    8. Shopping apps, Travel apps and Food Apps have seen a huge drop in both users/ week and time spent/user/week.


    9. It’s not just TV viewership that has seen an increase –advertising FCT on TV has increased by 13%.


    Measurement considerations:

      BARC Nielsen Smartphone Panel
    Coverage All India (Urban + Rural) All India (Urban 1 Lakh plus)
    TG ALL NCCS 2+ years NCCS ABC 15-44 years

    Android Smartphone Users

    Time Period PRE COVID  – 11th Jan 2020- 31st Jan 2020 PRE COVID –  13th Jan 2020 – 2nd Feb 2020
    COVID DISRUPTION – 14th March 2020 to 20th March 2020 COVID DISRUPTION – 16th March 2020 to 22nd March 2020
    Week definition Saturday to Friday Monday to Sunday


  • When Subscription Outpaced Advertising Growth…

    Source: FICCI EY M&E Report 2019


    By Indrani Sen


    The FICCI EY M&E Report ‘The era of consumer A.R.T. – Acquisition Retention and Transaction,’ released on March 27, 2020 shows that the Indian Media and Entertainment (M&E) sector outperformed the Indian economy (nominal GDP growth) for the third successive year with a growth of 8.9% over 2018 and reached INR1.82 trillion (US$25.7 billion) in 2019.


    Advertising revenue grew 5.3% while subscription revenue grew 9.3% in 2019. Subscription growth was driven by OTT video consumption (111%), film (10%) and television (7.5%) which resulted in EY labelling 2019 as “The Era of Consumer A.R.T. – Acquisition, Retention and Transition”.

    Source: FICCI EY M&E Report 2019


    Ashish Pherwani, Partner & M&E Sector Leader, EY India has added a word of caution in his forwarding note. “The current situation around the Coronavirus will, unfortunately, impact the 2020 estimates we have provided in this report, and we will update the same as soon as we can reasonably estimate its impact,” he has written. Coronavirus is going to affect both the Indian Economy as well as the M&E sector. While it is certain that the growth rates of both will see dips, how much they will dip remain a matter of speculation at this stage.


    As things stand now, it is unlikely that the Indian economy will see a negative growth, but it is highly possible that M&E sector may experience the same as it did in 2009 after the international financial crisis of 2008 triggered by the sub-prime mortgage crisis in the US. Effectively, we can use the FICCI EY M&E Report 2019 for reviewing the trends and growth different media in 2019 over 2018, but cannot rely on the future forecasts shown in the report, till EY releases an update.


    In 2019, two traditional segments, print and radio ended the year with de-growth in ad revenues, despite their growth curves remaining relatively flat for the first seven to eight months of 2019. However, print remained the second-largest segment after television, followed by Digital media as the third.


    Digital media rode on growth of both subscription and ad revenue and overtook filmed entertainment in 2019 to become the third largest segment of the M&E sector. Digital subscription revenues more than doubled from 2018 levels and digital advertising revenue grew to attain a share of 24% of total advertising spend.


    Online gaming retained its position as the fastest growing segment on the back of transaction-based games and a 31% growth in the number of online gamers to reach around 365 million.


    The following table shows the details of the growth by different media in 2019:

    Source: FICCI EY M&E Report 2019


    A detailed analysis reflects that ad spends increased by INR40 billion in 2019 over 2018 due to INR37 billion growth in digital and an INR15 billion growth in television, reduced by a fall of INR12 billion across local traditional media (print, radio, OOH).  Advertising growth was muted due to overall economic slowdown in 2019 which also impacted festive ad spending.


    Source: FICCI EY M&E Report 2019


    The growth in subscription revenue was driven largely by the proliferation of mobile access, enabling on-demand, anytime-anywhere consumption of content across India, in both urban and rural areas. In a country with 1.3 billion population, we have 688 million internet subscribers and nearly 400 million smartphone users and a tele-density nearing 89% of households. Riding on such statistics, India’s telecom industry is poised to become the primary platform for content distribution and consumption. Today, India ranks as one of the fastest-growing app markets across the world with entertainment apps as well as gaming apps driving significant consumer engagement which is likely to accelerate as people are forced to stay at home and work from home during the current 21 days lockdown and in the event of the lockdown extending beyond mid-April, 2020.


    We can safely assume that in 2020, the effects of Covid-19 will be more on ad revenue than on subscription revenue in the M&E sector.  It is too early to make any estimate regarding the effects on ad revenue of individual segments of the M&E sector. With the rush of migrant labourers wanting to go back to their home states, we seem to be sitting on the tip of an iceberg as we step into the crucial first week of April/the second week of nationwide lockdown to fight the deadly Coronavirus, to hope and to ensure that India does not get into the stage of community transmission.


  • Television, Smartphone consumption leapfrogs


    By A Correspondent


    The disruption caused by Covid-19 continues to result in television viewership, smartphone usage and video-on-demand (OTT) consumption. Week 12 of the BARC ratings saw Total TV consumption skyrocket. This was determined in the insights provided by TV audience measurement body BARC and research major Nielsen on Thursday. The second edition of the ‘Crisis Consumption – An Insights Series into TV, Smartphone and Audiences’ was presented by the research bodies.


    According to the report, there has been growth in TV and Smartphone consumption across geographies, socio-economic classes and age groups. Television viewing in Week 12 stood at a record 1.2 trillion minutes and the average daily viewers grew by 62 million ad 622 million viewers watched television daily for four hours, forty minutes.


    The lockdown period registered many ‘firsts’ in television viewing history. News and Movies recorded an all-time high growth in viewership, in fact Hindi movies surpassed Hindi GECs The all-India consumption increase was 37 percent over the previous week. Viewership grew significantly post-lockdown on March 25, 26 and 27.


    Being the first week of lockdown there was a sizeable growth in all demographics, thought particularly amongst males. Non-primetime viewership surged by more than 70 per cent, and growth in Hindi-speaking markets was higher than the south.


    While movie channels along with News and Kids grew higher than GECs, the general entertainment channels grew in non-primetime by 32%. News saw a growth of more than 200 per cent. In fact the share of news to Total TV leapfrogged from 7% to 21% at an all-India level in both primetime and non-primetime.


    As for advertising, the average FCT in Week 11-12 grew 15 per cent – by 6 lakh seconds. Week 11-12 saw a growth across genres except for sports and youth.


    On the digital front, consumption of news continues to show a huge increase, and Chatting and Social networking show a significant increase in timespent. E=commerce though has suffer due to difficulties in logistics management in the lockdown


    According to the report, The re-telecast of epicserial Ramayan garnered the highest ever rating for a Hindi GEC show since 2015.


  • Forced confinement leading to increase in TV consumption, but…


    By Indrani Sen


    On March 27, 2020 Nielsen and BARC India shared the first edition of their report “Covid-19 Impact- What’s happening in the TV and smartphone landscape” with the industry at large analysing how the lockdown has increased TV viewership in India. In the first week of the partial lockdown from March 14 to March 20 (BARC Week 11), the all-India TV viewership in minutes/week went up by 8% and TV reach went up y 6%. Overall time spent on TV went up by 2%.


    BARC conducts television audience measurement in India while Nielsen passively captures smartphone behaviour through a 12,000 strong smartphone panel. The time spent on smartphones per user also went up by 6.2%. The time spent/user/week on VOD apps saw an increase of 3%. News apps saw 8% more users per week with an increase of 17% in time spent/user/week stimulated by use of non-English News apps (+87%). Gaming apps saw an increase of 2% in users/week supported by 11% increase in time spent/user/week.


    We will look more closely at changes in TV audience behaviour. In Week 11, average daily viewers grew by 32Mn supported by kids, younger age groups and NCCS A. Viewing time for Television increased by over 70 billion minutes in India with each of 592Mn viewers watching TV daily for 3hr 51 minutes. Strangely, there was hardly any growth in the primetime viewership as the growth in viewership was driven by non-prime time. GECs also grew by 32% in non-primetime slots, but saw a 15% dip in the primetime slots which was higher (23%) in the Hindi Speaking Market (HSM) than the south Indian market (5%). An analysis by genres given below show that news, kids and movies gained the most in terms of daily ATS followed by infotainment, lifestyle and youth.


    Last week, Nielsen and BARC released the second edition of the ‘Crisis Consumption: An Insight Series into TV, Smartphone and Audiences’ report of Week 12 (starting March 21) where four days  coincided with the first week of country wide lockdown, showing an unprecedented growth of  298%  in TV news viewership. The increase in the viewership of news channels was accompanied by a 15% growth of average daily free commercial time (FCT) to 6 lakh seconds in between March 21-27 (Week 12) compared to January 11-31, 2020 or the pre-Covid-19 period reflecting last-minute changes in the allocation of TV budgets.


    All the parameters reported by BARC showed increases during Week 12 with the weekly viewing minutes (total number of minutes spent watching TV) touching 1.2 trillion. The number of people watching TV all seven days a week jumped from 32% to 44%, the average time spent per viewer increased 23% from 3 hours 46 minutes to 4 hours 39 minutes. As a result, the total number of channels consumed per viewer in the week also increased from 16 to 22. This surge is TV viewership is expected to continue during the next few days of the nation wise lock down and the spread of Covid- 19 in India will decide its future course.


    It is heartening to see that the news genre has been able to get additional advertising during this lock down period. Kids’ genre, with 20%+ share of total TV viewership and only 3% share of the overall advertising space, has not been so lucky. However, on the whole the prognosis is not good when we look at ad revenue of TV channels in immediate future. Going by the current trends, TV channels will hardly be able to convert this increase in viewership to increased ad revenue. Financial Express reported on March 21, 2020 (https://www.financialexpress.com/brandwagon/coronavirus-impact-ad-expenditure-to-decline-by-50-55-on-tv-between-april-june-2020/1914445/) “As the novel Coronavirus continues to wreak havoc around the world, television is one such industry which is currently under its grip, besides other sectors. According to industry estimates, advertising expenditure on television is expected to decline 50%- 55% to anywhere between Rs 3,750 crore – Rs 4,125 crore between April-June, that is Q1 FY2021 – if the lockdown continues.”


    The economictimes.indiatimes.com reported on April 2, 2020 in similar lines, though their estimate of the loss was pegged at 30-40% than 50-55% reported by Financial Times – “Top broadcasters, media buyers and advertisers ET spoke with, feel that if the situation doesn’t improve by end of April, the TV industry will end up with a 30-40% drop in ad revenues in April and May.” (https://economictimes.indiatimes.com/industry/media/entertainment/media/broadcasters-stare-at-drop-in-ad-revenues/articleshow/74937708.cms?from=mdr)


    While we wait for FICCI-EY to release an update of their report on M&E industry, FICCI’s recent report on the impact of Covid-19 on the Indian economy has predicted that the pandemic will potentially derail India’s growth story by affecting both the demand and the supply side. We are going through unprecedented times when it is extremely difficult to predict even the immediate future.


  • 10 Takeaways from BARC India-Nielsen Media TV/Smartphone consumption given Covid-19


    By A Correspondent


    Some four weeks back television audience measurement joint industry body BARC India and Nielsen Media unveiled the “Crisis Consumption on TV and Smartphones” series of reports with in a web-based presentation. The fourth edition of the report was presented on Thursday (April 16) and over 950 professsional from across industry were present.


    BARC India, as we know, is the official currency on television measurement in India and Nielsen Media runs a 12,000 strong smartphone panel in India passively capturing smartphone behaviour.


    Some of the key highlights of TV and Smartphone consumption during the fourth week of the 40-day National Lockdown are as follows: –

    1. COVID-19 is taking the most mind space with ~40% of top 100 Google searches last week being in COVIDand 1 in 8 consumers accessing the AAROGYA SETU app

    2. PM’s addresson Lockdown extension garnered 4 Bn viewing minutes  – the highest of the 4 addresses on COVID-19

    3. TV consumptions grows 38% over pre-COVID periodnow at 2 Trillion minutes

    4. Hindi GEC attains all time High Viewership of 4 Bn since 2015 in HSM Urban this week

    5. Movies show an increase across HSM, while GEC maintains share and continues to lead in South markets

    6. Top 5 content for digital audiencesis a mix of Fiction, History, Mythology and Supernatural

    7. Premium audiences onDigital clock remarkable growth in time spent on News, Chat, Fitness and Streaming

    8. The News franchise on Digital is close to 50% now (+25% over PreCovid period) – Video News consumption shows a huge growth of 75% over the PreCovid period

    9. COVID Lockdown  gives a big fillip to Education Apps, Surge by 30%+

    10. Overall FCT on TV drops by 26% over the PreCovid period- however a 142% increaseseen in FCT for Social Ads – Digital ads also showing a slowdown in last week


    Considerations:


  • The Internet Gets Mainstream, Finally


    By Indrani Sen


    On May 8, 2020, the Media Research Users Council India (MRUC) released its findings of the last and final quarter of Indian Readership Survey 2019. Fieldwork of IRS 2019Q4 covered the period from December 2019 through March 2020 and the report has data based on a rolling average of four quarters of IRS 2019 data i.e. Q1+Q2+Q3 and Q4 2019.


    The highlights of the readership trends among English and vernacular titles have already been reported and analysed by different industry websites. The highlights of the survey- presented jointly by Nielsen and MRUC – has noted that: “Newspaper readership, is on a slow decline and is a trend seen across Hindi, English and Regional languages”. Vikram Sakhuja, IRS Technical Committee Chairman and Group CEO Madison Media & OOH, Madison World has noted in the press release: “(The) ability to read and understand English has increased and while overall print readership is holding, daily readership has started showing signs of decline.”


    According to the highlights of the report, a “rapidly evolving media landscape with multi-media adoption is seen across consumer strata resulting in large media markets, both traditional and digital with substantial increase in Internet penetration lifting it to mainstream along with TV and Print.” Moreover, the report has acknowledged “There was more number of internet users (Last 1 month) in rural now then urban.”


    Source: IRS2019Q4


    If we consider that the fieldwork for March 2020 ended before the National Lockdown due to Covid-19 was imposed on March 25, 2020, we can easily guess a further surge of internet users has happened across urban and rural India in the last seven weeks. Unfortunately, as the IRS fieldwork also is on hold now, we will have to wait for sometime before we get a clear indication of the media usage during the total and subsequently partial Lockdown enforced by Covid-19.


    IRS2019Q4 highlights have also given us a glimpse of how Indian consumers today are more equipped and more connected than before as shown in the following chart. There would not be significant change in the connectivity except during the lockdown both ‘shop from modern trade’ and ‘online shopping’ may go down and ‘access social media’ may go up substantially.


    Source: IRS2019Q4


    This calls for a total change in the approach of media planning where TV and Digital would have to be planned simultaneously now supplemented by Print, Radio and OOH plans. It would also be beneficial to plan for TV and Digital under the same roof by the same media agency than to distribute the business by traditional media and digital media to two different media agencies.


    Unfortunately, we still do not have single source data for TV and Digital media users which is essential for preparing cutting edge media plans. BARC’s plan for providing such data have been shelved indefinitely reportedly due to non-cooperation by Google and Facebook and instead of finding a solution to that problem, TRAI has now created other problems for the ongoing research on TV viewership with their new directives about TV viewership research. So, as internet continue to surge ahead as a mainstream media, media agencies will keep struggling with data and insights for doing justice to their media plans.


  • OTT is great, but no Goodbyes to Theatres. Not yet


    By A Correspondent


    Ormax Media conducted a special study on theatre-going behaviour given the impact it has had by the Covid-19-led lockdown. The study measure audience sentiment about visiting theatres when they re-open, expectations and change in behaviour at the theatres, audience trust in various exhibitor brands in effectively implementing safety measures and the consumption of films on television and OTT platforms during the lockdown.


    Here is the Executive Summary of the findings:

    1.Audience have given whole-hearted endorsement to the theatrical experience, with 82% missing going to the theatres a lot during the lockdown

    2. A dominant section of audience believe that they will go back to the theatres within 2-3 weeks of them re-opening. However, social distancing and sanitization precautions taken by theatres will play a crucial role in their decision to visit

    3. Contrary to a perception being built in the trade and the media, high consumption of films on TV and OTT has not reduced the audience attraction for the theatrical experience

    4. 69% audience said they will visit theatres not just for big-scale films but for medium and small films too

    5. Economic considerations don’t emerge as a major factor in the decision to revisit theatres. Audience would rather have theatres keep the ticket price unchanged and spend money on implementing safety measures, than offer discounting to boost footfalls

    6. F&B consumption at the theatres is likely to be impacted by about 60% during the period of Covid-19

    7. The national chains score high on audience trust to effectively implement safety measures. However, chains with limited geographical presence, and single screens, are seen to lack this credibility

    8. Communication of safety measures undertaken by theatres will be a crucial factor to persuade audience to visit theatres when they reopen


    BackToTheTheatre-OrmaxMedia-May2020_compressed