Marketing service research firm Warc has released the results of its annual worldwide survey of senior strategists, distilling their opinions on the changing role of strategy within a shifting marketing landscape.
Warc’s Future of Strategy report, now in its third year, is based on a survey of 800 senior strategists from around the world to provide an in-depth study of both the challenges and opportunities for strategists going forward.
Said Amy Rodgers, Managing Editor, Research & Rankings, Warc: “Warc’s Future of Strategy 2019 report reveals a discipline that is changing. We see an increased focus on customer experience, growing competition from non-agency shops, and the continuing battle to sell and price its value. And whilst the influence of strategists has increased, the role needs clarity in both function and value if it is to thrive.”
The key findings from the report include:
– The rise of CX offers new opportunities
Customer experience (CX) is dominating the marketing agenda. Almost half of the strategists surveyed are doing more work on CX for clients this year, and for a quarter, work for direct-to-to-consumer (DTC) brands has increased. Respondents see this as an exciting opportunity as the strategist role and craft skills evolve to shape brand experiences and brand truths.
– Most strategists want to leave agency life
The growth in CX is driving demand for the strategic services of consultancies, which have used their tech and data heritage to position themselves as experience experts. One outcome of increased competition is that strategists are becoming untethered from their traditional place within agencies, with more career options to choose from. Whilst 40 per cent of strategists surveyed say their team has grown over the past year, 63 per cent do not think their next role will be with an agency.
– Lack of clarity undermines strategy’s value
The movement of strategists away from agencies may be exacerbated by the perception that strategy is being undervalued in agencies. Though most believe their influence is growing internally, selling the value of strategic services to clients is a challenge in an environment of budget cuts and a lack of understanding around the role. Strategists see their value in working on upstream business problems and drawing insights from data. However, the reality is that they spend their time juggling both upstream and downstream work.
– Despite all the data, strategists need the human touch
Strategists were almost unanimous (92 per cent) in the feeling that they would do a better job if they had more access to client data. In the age of ‘big data’, the disciplines of strategy and analytics are increasingly merging as strategists are being asked to make use of the wealth of first-party data that brands now own. However, data alone will lead to predictable, unexciting advertising. Strategists need to retain the link to ‘real life’ and use their understanding of consumers and culture to drive creativity.
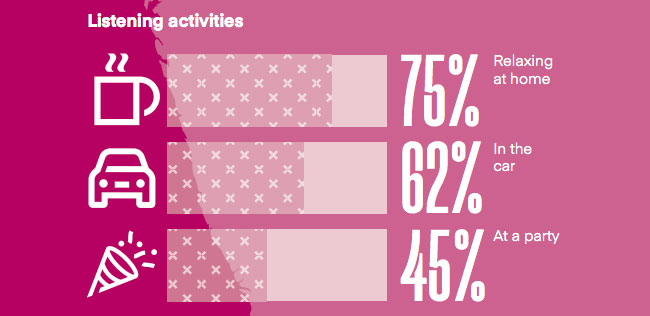
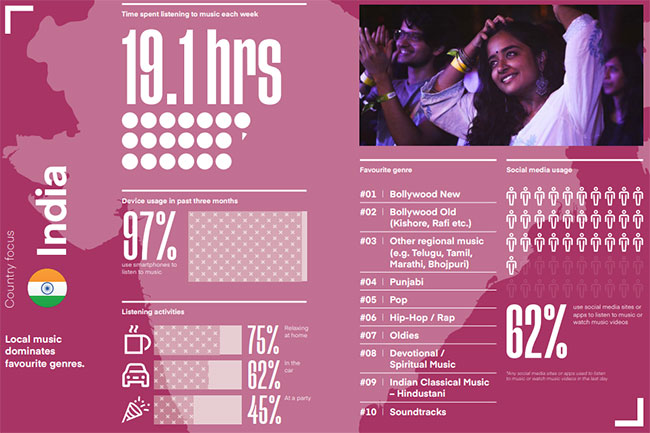
IMI, the organisation that represents the recorded music industry in India, has released the Digital Music Study 2019, which examines the ways in which music consumers aged 16 – 64 engage with recorded music in India.
Some highlights from the report include:
– Music listening is up: respondents typically spend 19.1 hours per week listening to music – higher than the global average of 18 hours. This equates to about 2.7 hours – or the equivalent of listening to 54 three-minute songs – daily.
– Most people (80 per cent) identify as loving or being fanatical about music, much higher than the global average of 54 per cent.
– Older age groups increasingly embrace audio streaming services: engagement with audio streaming in India is strong, with 90 per cent of all respondents accessing a music streaming service in the past month. The highest rate of growth for engagement is in the 16 – 24-year-old age group, with 97 per cent of that group accessing a music streaming service in the past month.
Said Blaise Fernandes, President and CEO, IMI: “The Digital Music Study 2019 has revealed some illuminating trends in India: the 80 per cent music fandom base, the highest in the world, is the main reason for the 21.3 per cent growth rate India achieved over the past years. The top two favourite genres are Bollywood new and old. The fastest growing segments are of consumers in the age groups 25-34 and 35-44, which is the perfect launch pad for a premium subscription-based model in India. 67 per cent piracy rates remain a matter of grave concern.”
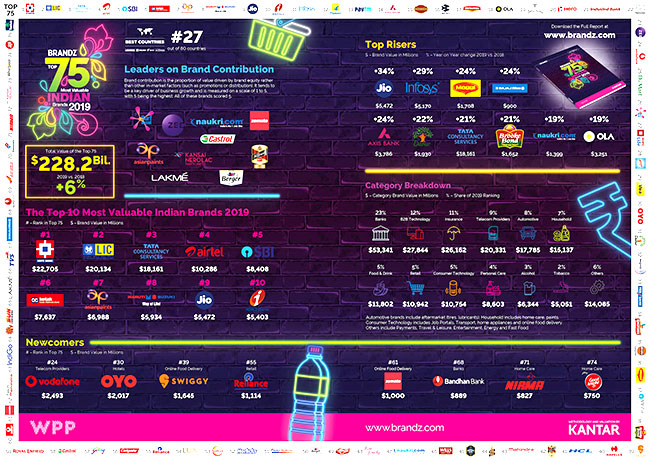
The BrandZ study, which is the only brand valuation ranking to combine companies’ financial data with consumer insight and opinion, shows that trust is key to develop the stability required for long-term success; highly trusted brands in the Top 75 are worth 129% more than less trusted ones.
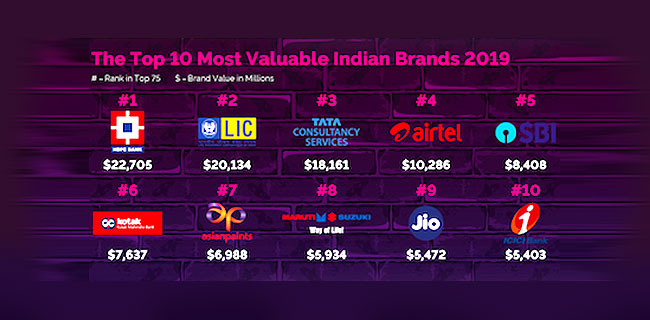
BrandZ Top 10 Most Valuable Indian Brands 2019
Rank 2019
Brand
Category
Brand Value 2019 ($M USD)
Brand Value Change
1
HDFC Bank
Banks
22,705
+5%
2
LIC
Insurance
20,134
+2%
3
Tata Consultancy Services
Technology
18,161
+21%
4
Airtel
Telecom providers
10,286
-10%
5
State Bank of India
Banks
8,408
+7%
6
Kotak Mahindra Bank
Banks
7,637
+15%
7
Asian Paints
Paints
6,988
+14%
8
Maruti Suzuki
Automobiles
5,934
-14%
9
Jio
Telecom providers
5,472
+34%
10
ICICI Bank
Banks
5,403
+11%
Notable brands include ecommerce site Flipkart (No. 12), which increased its brand value 14% to $4.7 billion, while unicorn brands hotel booking site Oyo ($2.0 billion), online food ordering service Swiggy ($1.6 billion) and online restaurant marketplace Zomato ($1.0 billion) are newcomers to the ranking at No. 30, No. 39 and No. 61 respectively.
The fastest riser in the 2019 ranking is telecom provider, Jio, which climbed one place to No. 9 with a 34% increase in brand value to $5.5 billion. Its disruptive business model has made internet access available to many Indians who were previously unable to afford it, thereby opening up access to digital platforms and services. Vodafone ($2.5 billion) meanwhile was the top-ranked newcomer at No. 24.
Both digital and offline brands such as D-Mart (No. 25, $2.4 billion) have found success as a result of the rise of ‘middle India’; the growing number of people in the country’s second, third and fourth-tier cities and towns that are changing India’s traditional urban-rural divide. These previously poorly-served segments increasingly have access to a variety of online services, with Swiggy and Zomato building much of their growth on this shift.
Said David Roth, CEO of The Store WPP EMEA and Asia and Chairman of BrandZ: “As India flexes its muscles on the world stage, it faces increased macroeconomic headwinds which have combined with a rise in global trade tensions to create a challenging environment. Successful Indian brands are adapting to these challenges and recognising that longevity requires them to do more than just disrupt the status quo; long-term brand building requires new strategies that major on stability.”
Added Preeti Reddy, CEO South Asia, Insights Division, Kantar: “Consumer trust is a common thread among successful brands. However, it is concerning that only a few have succeeded in growing trust over the last five years. Those who done so, have done it through open and honest conversations with their customers. Brands would do well to consciously work at building consumer trust – it is the shield that gives a brand the resilience to face headwinds in uncertain times.”
Said Vishikh Talwar, Chief Client Officer, Kantar Insights Division: “The rise of ‘middle India’ combined with rapid growth of the mobile internet is providing unprecedented opportunities for brands. But, with an almost overwhelming choice of products and services to buy, consumers are increasingly discerning; the Indian psyche requires that brands cater for local needs with offerings that genuinely improve daily life. Today that’s as much about providing comfort and reliability as it is about generating new experiences.”
Key trends highlighted in the BrandZ Indian Top 75 study include:
:: Mobile internet access:Smartphone user numbers in India increased by 18% in 2018 (the fastest rate of growth in the world), mainly due to a combination of Jio’s own low tariffs and the renewed competition causing other telecom providers to reduce their rates.
:: Buying power:Retail is the second fastest growing category, with online and offline both growing strongly. New entrant Reliance Retail (No. 55, $1.1 billion) opened nearly 500 new stores and used Jio’s service to connect retail shops with grocery deliveries, while D-Mart ($2.4 billion) focused predominantly on offline, rising two places to No. 25.
:: The Amazon effect: Amazon and Flipkart compete with many Indian brands across several sectors, with Amazon also opening its largest campus yet in India. This has increased competition and driven brands to step up their operations to ensure they are meeting customers’ needs.
:: A confident country: The success of unicorn brands such as Swiggy, Zomato and Oyo is fostering a new-found confidence in India. This is augmented with the increasingly global outlook of these new brands as they actively seek to expand their operations outside India.
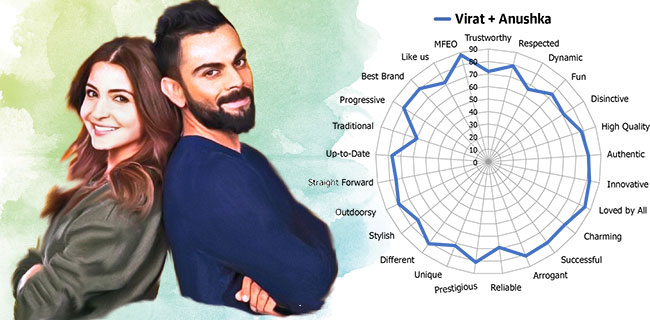
The Mumbai-based Indian Institute of Human Brands (IIHB) has unveiled its study on ‘Power Couples’ in India. Called the Sparklers Report, it features a study of the following duos: Virat-Anushka, Deepika-Ranveer, Ranbir-Alia, Akshay-Twinkle, Abhi-Ash and Saif-Kareena… what it bills as “the hottest, and commercially-most-in-demand couples in the country”.
Sandeep Goyal
Said Dr Sandeep Goyal, veteran adperson and Chief Mentor of IIHB: “Power Couples are the new phenomenon in the brand endorsement business with many brands trying to sell aspirational and experiential products to millennial couples who are starting families, using famous couples as the ones to emulate. But there is no empirical research so far on what these Power Couples actually represent or how they are seen by potential audiences. At IIHB we decided to track each one of these trail-blazing couples over a set of 24 important brand attributes,” adding: “There is also an interesting throw-back study on Romantic Couples of Bollywood since Partition, something never researched before”.
Here’s the report:
Who are Power Couples?
A Power Couple is a couple who is famous and accomplished; and together seen to be successful and influential in society. More importantly, each of them is individually successful and influential. Together they are the epitome of what anyone would desire or want in a relationship. Hence, admired and emulatable.
Where did the term Power Couples come from?
It was during the FIFA World Cup 2006 that David Beckham and Victoria Caroline Adams (also known as Posh Spice from her singing days as part of The Spice Girls band) were a toast of the celebrity circuit. With media coverage of the World Cup including the wives and girlfriends (WAGS, as they are called) of the stars, David and Victoria Beckham became the original power couple for Indian celebrities to take a cue from. Today, the term is on steroids in Indian media.
Why did it take so long for India to have its own Power Couples?
The Power Couples Report gives interesting perspectives on how Bollywood and cricket could’ve given us these aspirational sparkler couples much earlier but a long list of famous celebrity couples … Dilip-Saira, Sunil Dutt-Nargis, Rajesh Khanna-Dimple, Amitabh-Jaya, Nawab Pataudi-Sharmila, Dharmendra-Hema, Rishi-Neetu, Gavaskar-Marshneil, Dhoni-Sakshi, Sachin-Anjali, Azhar-Bijlani … somehow fell short of the ‘famous-together’ threshold despite being well-known.
The IIHB Report earlier this year researched current ‘Sparklers’ and the six listed above – Virat-Anushka, Deepika-Ranveer, Ranbir-Alia, Akshay-Twinkle, Abhi-Ash and Saif-Kareena – were shortlisted for a more detailed study. Kajol-Ajay Devgn, Shahrukh-Gauri, Madhuri-Dr. Nene and Priyanka-Nick were also researched but their score together remained below acceptable threshold.
What are the key attributes to Power Couples?
Trustworthy, Respected, Fun, Distinctive, Charming, Different, Stylish, Progressive, and MFEO (Made-For-Each-Other) are some of the key Image, Human and Personality brand attributes that add value to Sparklers. The IIHB study covers 24 such attributes.
Who are the winners?
On select attributes:
TRUSTWORTHY
Rank
Couple
Score
1
Virushka
72
2
DeepVeer
70
3
AksTwink
65
RESPECTED
Rank
Couple
Score
1
Virushka
79
2
DeepVeer
78
3
AksTwink
74
DISTINCTIVE
Rank
Couple
Score
1
AksTwink
74
2
DeepVeer
72
3
Virushka
71
DIFFERENT
Rank
Couple
Score
1
RanbirAlia
81
2
Virushka
81
3
AksTwink
80
TRADITIONAL
Rank
Couple
Score
1
DeepVeer
72
2
AbhiAsh
70
3
AksTwink
68
STYLISH
Rank
Couple
Score
1
RanbirAlia
76
2
Saifeena
75
3
AksTwink
74
Without a doubt, Virushka and DeepVeer top score across most attributes, with AksTwink a respectable third despite being much older. Ranbir-Alia despite not being married (the only unmarried couple in the Top 6) do well too, especially on being seen as ‘Different’. Saifeena are ‘Stylish’ (after all he is a Nawab and she is true-blue Bollywood royalty) but Abhi-Ash who trail on most attributes are seen to be ‘Traditional’.
Pointers from the study
:: All the couples are bunched together fairly close, yet have attributes that differentiate them, hence can be leveraged by brands.
:: Virushka and DeepVeer are very close in imagery … they top score across the attributes.
:: AksTwink are ‘Straight Forward’ and ‘Like Us’, hence most relatable. Brands need to leverage this in communication.
:: Saifeena are ‘Up To Date’ and ‘Stylish’ but ‘Arrogant’.
:: Abhi-Ash are the laggards of the survey. That may not be hard to explain … careers of both partners are largely in doldrums.
“So far very few Power Couple ads have been exceptional … the best, without doubt being the Maanyavar ad of Virushka. But most others including DeepVeer (Lloyd’s), RanbirAlia (Lay’s) and Saifeena (AirBnB) don’t really sparkle on creatives. Advertisers and their agencies need to carefully match brand attributes to those of the celebrity couple and maximize what the duo best stand for”, says Dr. Goyal.
The Romantic Couple survey in the later part of the Report shows various couple combos over the years with the honours going to:
1950s : Raj Kapoor and Nargis
1960s : Guru Dutt and Waheeda
1970s : Amitabh and Rekha
1980s : Amitabh and Parveen Babi
1990s : Shahrukh and Kajol
2010s : Ranbir and Deepika
Amitabh Bachchan is paired amongst the best in two decades with two different heroines. India’s most famous romantic hero Rajesh Khanna doesn’t make the grade despite famous pairings with Sharmila Tagore, Asha Parekh and Mumtaz.
MRUC has issued an RFP (Request for Proposal) inviting research partners to pitch for the contract to conduct the Indian Readership Survey. MRUC’s contract with the incumbent agency, Nielsen India, concludes with the release of the last and final quarter of IRS 2019data – Q42019.
Pratap Pawar
Said Pratap Pawar, Chairman, MRUC and Chairman of Sakal Media: “We are looking forward to receiving and studying each and every proposal from various research agencies. They will be evaluated basis their understanding on IRS, on meeting our research requirements stated in the RFP and of course what more they can offer beyond our stated requirements.”
Shashi Sinha
Added Shashi Sinha, Vice Chairman, MRUC and CEO of IPG Media Brands: “Security enhancements and measures taken to ensure accuracy in data will be some of the key objectives in selecting the new research partner. We will be working closely with industry stakeholders in the selection process and ensure the industry gets the best partner to conduct the world’s largest study – IRS”.
Vikram Sakhuja
Said Vikram Sakhuja, Chairman, IRS Technical Committee and Group CEO Media & OOH, Madison: “Over the years we have brought in a lot of automation, technology and controls to ensure that we get valid and reliable data for IRS – India’s most widely used Media establishment study. In this RFP we are looking for an Agency who can give us confidence in their mastery in Fieldwork, and who can impress us on enhancing the controls while minimizing the cost. I wish all participants the very best.”
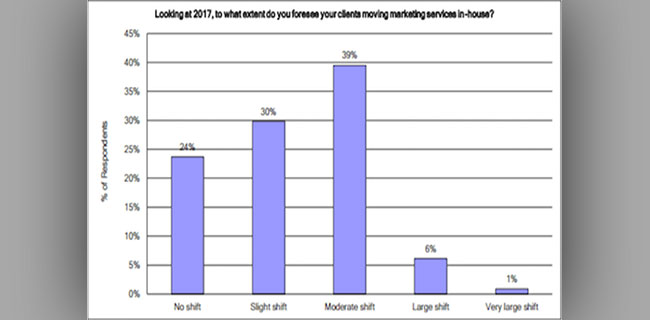
According to the grapevine, some global media agencies are contemplating a move to allow clients to take media and planning inhouse. Noted one report suggesting that information coming in from the UK suggest a certain large networked agency is in for a significant restructure that may possibly include the group launching a separate business to help clients take their media and planning inhouse. This would have been unthinkable even in the first decade of the twenty-first century when the media agencies went on an integration drive to offer as many services as possible from one stable to their clients.
But times have been changing and changing at a very first rate. Globally, consulting agencies have started competing for a share of the media (planning and buying) business and have started enjoying a high rate of growth. In order to counter competition from the consulting agencies, media agencies have rewritten their profiles as consultants and have started offering to their clients multiple choices for doing business. But their woes do not end just with countering the move by the consulting agencies. The bigger threat is coming from the clients themselves, many of whom are planning to move some of the agency work in-house.
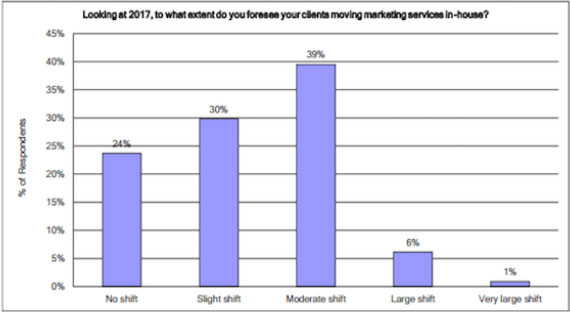
The above trend has set in from first decade of this century with clients initially hiring media executives and managers to interact with their media agencies for ensuring better ROI. The move gradually expanded to clients shifting some of their marketing services in-house. The 2017 RSW/US New Year Outlook Report indicated that 84% of the marketing businesses themselves were planning a transition which may result in assigning on an average 20% less work to agencies.
Source: 2017 RSW/US New Year Outlook Report
In this changing business climate, what could be a better move than launching a consultancy business to help clients to take media and planning inhouse? Data monitoring and gathering, transactional capabilities, like programmatic planning and buying, optimisation through SEM and SEO, can easily be shifted in-house to give clients scope for driving efficiencies guided by the consultants from media agencies. This move will help to kill two birds with one stone, to counter the consulting agencies by providing data strategies to brands and to establish a better client-agency relationship which is essential for retaining the accounts in the long run.
It may be difficult for individual clients to keep pace with technological changes like AI, VR, Voice, etc. The media agencies can play a role in providing clients with solutions for applications of such new technologies. In other words, the business of media agencies may shift from media planning and buying to creating solutions to marketing problems and application of the solutions across various technologies and platforms for reaching the target audience with least wastage.
In the last quarter of twentieth century, creative agencies were focussed on creating big ideas, but their ideas were not data driven. The media agencies at the same time were focussed on data based strategies, number crunching and negotiating for best rates and deals. They were not interpreting data in creative ways, on weaving a story with data analytics. The future of media agencies lies in marrying creativity with data and analytics, a lesson which they should learn from the newer digital agencies who have gone back to the good old full service mode under one umbrella.
Base: 19,443 online adults aged 16-74 across 27 countries, 20 September to 4 October 2019
By A Correspondent
Given the huge global focus on Gender Equality, Diversity and Inclusion, a global survey by Ipsos in partnership with the Global Institute for Women’s Leadership, Policy Institute, World Questions: What helps or hinders gender equality? – unlocks the key factors that help women get ahead; it is particularly interesting as it provides insights across all markets put together (at the global level) and by local markets.
What works for Indian women? Top factors that propels them forward are achievable on their own.
According to urban Indians, the top 6 factors that lead to elevating women’s status are –
qualification (31%), confidence (31%), intelligence (30%), hardwork (30%), never giving up
(24%) and being brave (24%).
And for global women?
The drivers are somewhat different: Hardwork (29%) is at the top, followed by intelligence
(27%), qualification (27%), competence (27%), confidence (25%) and never giving up (25%).
And what makes Indian men get ahead?
Hardwork (37%) sits at the top, followed by intelligence (29%), qualification (27%), confidence (25%), success (19%), competence (17%) and Never giving up (17%), being brave (16%), political connections (15%), being well behaved (15%), being polite and kind to others (13%), good sense of humour (11%) and their looks (8%).
Said Amit Adarkar, CEO, Ipsos India; Operations Director, Ipsos APEC (Asia Pacific excluding China): “The findings definitely challenge age old beliefs about what works for women and men. These findings provide insights to citizens as well as marketers – citizens, when they look at the hierarchy of priorities for elevation of status and a better life – and marketers, of how they communicate in their adverts – we see a bit of a disconnect between what is portrayed and what actually works for a better life.”
Factors stopping Indian women from achieving gender equality with men For Indian women, urban Indians blame it on several factors – women lacking financial independence (22%), lack of education for men & boys (21%), too few women in positions of political power (17%), police not taking Violence Against Women (VAW) seriously (17%), employers not promoting women to senior positions (17%), employers not helping women to balance work & care responsibilities (17%), lack of knowledge around issues faced (16%), employers not addressing gender pay gap (15%), lack of access to education for women/ girls (15%), among others.
Interestingly, for global women, factors inhibiting their growth largely are to do with work policies: Employers not addressing gender pay gap (22%) is cited as the top global factor hindering progress of women. Others being, employers not helping women to balance work and care responsibilities (21%), employers not promoting women to senior positions (18%), lack of education for men and boys (17%), government not promoting equality (17%), men not helping achieve equality (15%) etc.
“Indian women largely either don’t work or are in the informal sector, where they get a short shrift. Lack of financial independence is the biggest stumbling block in their progress,“ added Adarkar.
Areas that have made most progress for Indian women – in achieving equality between men and women over the past 25 years.
Top factors that have greatly contributed in reducing inequalities between men and women are – women having equal access to education (44%), women having jobs in science and technology (36%), women being represented in govt and politics (35%), women’s participation in sport (34%), women having reached CEO/ board positions (33%), among others.
And what about the bext 25 years, what will work in further achieving gender equality? Top factors listed include – Women represented in govt and politics (42%), women holding senior positions in business (36%), women having equal access to education (36%), women having jobs in science and technology (34%) women reaching CEO/Board positions (32%).
“Women will further need to get into the male dominated bastions (power centres) to reduce the gap,” said Adarkar.
The survey is an international sample of 19,943 adults aged 18-74 in the United States and
Canada and 16-74 in all other countries. Interviews were conducted between September 20 and October 4, 2019. The survey was conducted in 28 countries around the world including India, via the Ipsos Online Panel system
Adspends in India will grow 12.6% in the year 2020, a slight increase from the 12.4% in the year 2019. This was part of the global ‘This Year Next Year’ report released by GroupM at a global level. It may be noted that GroupM presents its India-specific numbers every year in early February, which can hence be expected two months from now.
According to the numbers released, for India, the growth in television will be 11.1%, whereas for radio it will be 8%. The growth forecast numbers for newspapers and magazines are 1% and -10% respectively. While the growth for outdoor and cinema is pegged at 8.1%, that for internet will be 26.3%.
Prasanth Kumar
Said Prasanth Kumar, CEO, GroupM South Asia: In 2020, India faces challenges and uncertainties across sectors, just like other markets. However, this also brings opportunities for brands to innovate. This will be propelled by greater use of technology and better content across media.”
Meanwhile, here’s the rest of the report:
The global economy has weakened in 2019 and will remain similarly soft in 2020. By our calculations, based on Refinitiv data, the gross domestic product (GDP) of the countries we track in “This Year, Next Year” is growing by only +2.6% this year in real (inflation-adjusted) terms.
Growth in 2020 is expected to be similar (+2.5%), with only slightly faster growth (+2.8%) in 2021 and beyond. For reference, +2.5% would be the slowest pace of growth in any non-recession / non-recovery year over the past two decades. In nominal terms (including inflation), 2019 growth for these countries is expected to be +4.9%, down from growth of +5.8% in 2018 and +5.7% in 2017. 2020 looks somewhat similar to 2019, and marginal improvements follow in subsequent years.
Nominal growth rates are important to track because they are the most directly comparable figures to those with which marketers and media owners work in determining their own financial plans.
Personal consumption expenditures are holding up better. One factor that has probably helped sustain marketing growth so far this year is growth in personal consumption expenditures (PCE). As consumer spending represents more than half of all economic activity, PCE can be more important to monitor than GDP. Global growth in nominal PCE is holding up as well in 2019 as it did in 2018 at +5.5% in both years. Growth is expected to slow, but only modestly in the years ahead. Of course, changes in inflation levels diminish these figures, with expectations for real (inflation-adjusted) PCE growth at incrementally slower levels each year over the next five years.
Industrial production often correlates more tightly with advertising growth trends. Industrial production (IP) figures are another key set of metrics to monitor, as IP often correlates better with advertising activity than either GDP or PCE (manufacturers generally only make things for sale if they are planning to spend money on advertising them). Weighted against GDP in the markets captured here, we see pronounced weakness in 2019 and 2020 (+1.2% and +1.5%, respectively) relative to 2017 and 2018 levels (+3.5% and +3.1%, respectively). Recovery toward slightly higher levels is anticipated for 2021 and beyond.
Trade and other factors are key sources of uncertainty. As the Organisation for Economic Co-operation and Development (OECD) has pointed out, slowing global trade is clearly dragging on economic activity, and seemingly heightened geopolitical uncertainties are similarly unhelpful. All of this would worsen if the U.S. experienced a recession, although the U.S. economy has remained resilient, likely aided in part by low interest rates and corporate tax reductions, alongside a federal deficit of nearly $1 trillion during the most recent fiscal year. This was equivalent to more than a quarter of all government expenditures and nearly 5% of the overall economy, or more than double its recent trough in 2015.
Mean and median growth rates may tell different stories. We note the difference between mean and median growth rates, with larger economies expected to perform relatively better than smaller ones in the years ahead.
Global Advertising Growth Summary
In this environment, deceleration in advertising growth should be generally unsurprising. Global advertising, excluding U.S. political advertising (large enough to distort global growth rates by +/-1% each year), expanded by +5.7% in constant currency terms during 2018, capping the third year of better than +5% growth and the best year of the current economic cycle. However, 2019 appears set to grow nearly a percentage point slower at +4.8%, and growth is expected to slow by another percentage point in 2020 and 2021. We forecast +3.9% growth next year and +3.1% growth the following year. Growth is expected to range between +3–4% through 2024. Although much worse than recent years, we note that this would amount to a similar pace of growth to what was observed during 2012–2014. We estimate that the total global advertising market during 2020 will amount to $628 billion as we define advertising here, but would likely approach $700 billion on a broader definition that includes spending on direct mail and directories around the world.
Notably, a substantial share of global advertising is now accounted for by digital-first brands that are endemic to the internet. Based upon their securities filings, we can see that Alibaba, Alphabet, Amazon, Booking.com, eBay, Facebook, IAC, JD.com, Netflix and Uber are each now $1 billion+ advertisers, accounting for $36 billion in spending during 2018, up by a quarter over 2017 levels; growth in 2019 was presumably very similar. Adding a couple dozen companies from the next tier of comparable marketers would easily add tens of billions of dollars of additional activity. Combined, this small group of companies accounts for a majority of the world’s growth in spending on advertising. To the extent that these companies tend to take shares of consumer spending from others and do not directly cause the global economy to expand, at some point their growth converges with global averages, resulting in slowing growth in spending as well.
The median growth rate has exhibited sharper deceleration in 2019 than the mean. For the countries we have tracked with consistent data back to 1999, the median growth rate in 2018 was +5.2%. It is expected that 2019 will be +2.1%, followed by +2.7% growth in 2020, with generally slower growth than the weighted average. The difference between the mean and median highlights that growth is driven by a small number of large countries and that the typical small country is experiencing worse growth trends, bringing down the worldwide average. By contrast, median country growth was typically well above the mean as recently as 2013, reflecting a period where much of global advertising growth was driven by smaller countries. This maps to the aforementioned global economic trends.
The U.S. remains the largest global advertising market, with $246 billion in advertising as we define it here, and growing above global averages. With nearly 40% of the world’s total and a still-robust advertising market in 2020 and beyond (at +4–5% growth excluding directories, direct mail and political advertising), the U.S. is helping raise global averages. Our forecasts anticipate a slowing economy as well as the gradual maturation of the digital brands that have driven so much recent growth. On the basis described here, normalized U.S. advertising should slow from +7.6% in 2019 to +5.0% in 2020, +3.4% in 2021, and similar levels in subsequent years.
China’s $90 billion media market is maturing and beginning to slow, but is still more than two times the size of the number-three market, Japan. After many years of rapid growth, China is now solidly the world’s clear number-two market for advertising, with 16% of total media-owner ad revenue, nearly matching the country’s 17% share of global GDP. However, macroeconomic concerns—including issues referenced above and a general maturation of the Chinese advertising market—are weighing on growth
this year and beyond. We forecast growth of only +3.7% in 2019 and +1.4% in 2020. Similarly, low levels of growth are anticipated in subsequent years despite faster levels of economic expansion for the overall Chinese economy. Japan remains a solid number three, with 7% of global advertising ($41 billion in 2020) and 6% of GDP, but growth is expected to be tepid there as well; +1.7% growth in 2019 is expected to be followed by +1.8% in 2020, and closer to +1% in subsequent years.
The U.K. is still growing at a remarkably fast pace. Among larger advertising economies, the U.K. and the U.S. stand out for their healthy growth expectations. For the U.K., it is a feat made more remarkable given how much uncertainty has persisted over the past three years since the Brexit referendum. Five years ago, the U.K. was essentially tied with Germany as the number-four market for global advertising, but since that time the U.K. has grown by +44% while Germany has only expanded by 7%. The factors driving the U.K. are likely similar to those that have helped make the U.S. a strong market, including a substantial presence of digital brand spending as well as the expanding availability of ad inventory (in digital environments, primarily), which help make it possible for smaller marketers to use media. Although we do expect growth to taper off from the high-single-digit levels we have observed since 2014, solid mid-singles (+6.7% in 2020 and +5.5% in subsequent years) are now expected.
Germany and France are growing at below-global average rates; so is much of the rest of Europe. Brazil should be above average, while India is the world leader among larger media markets. Germany and France have certainly underperformed U.K. and U.S. levels of advertising growth in recent years, but remain in the number-five and number-six positions for now. France appears set to grow at a slightly faster pace than Germany, with a +2.8% five-year compound annual growth rate (CAGR) through 2024 for France versus a +1.6% CAGR for Germany. By 2024, Germany should still be the fifth-largest advertising market, but France will likely be overtaken in importance by both India and Brazil, currently number six and number seven, respectively. Brazil should grow at a solid +4–5% level through 2024 after a soft 2019 (we believe the ad market there grew by only +3.3% in 2019), but India should continue to be stellar, maintaining double-digit growth rates (we estimate +12–13% each year from 2020 to 2024, similar to 2019 levels). Of course, inflation is an issue for both of these countries, negating much of Brazil’s growth. However, in India the effect will only mean that real growth is in high-single digits rather than low doubles.
Canada and Australia are similarly sized markets, but they are growing in different directions. Canada and Australia round out the world’s $10 billion+ ad markets in 2019, with Canada expected to grow slightly faster over the next five years and growth likely largely tied to the health of its southern neighbor. Australia’s trends will likely differ, as we see at the present time with that country’s economy soft and facing a real risk of recession for the first time in decades. The Australian ad market was likely only stable in 2019 versus 2018 and probably grows only slightly in 2020, for a +2.0% gain expected next year. By contrast, Canada is expected to grow +5.0% in 2019, and should slow toward a high 3%+ growth level next year and in subsequent years. Overall around the world, 14 territories are expected to decline during 2019, with Italy the largest among them: We anticipate Italy will fall by -0.4%. Other large markets among this group include Mexico and Switzerland, which are expected to decline by -4.6% and -8.0%, respectively. Next year, fewer markets are expected to decline, with Switzerland the most significant among them
Digital disruption and new generational influences are making customer loyalty tough to hold onto these days, but fresh thinking on loyalty programmes is key to winning and retaining customers, according to KPMG International’s The Truth about Customer Loyalty report.
With the holidays nearing, KPMG’s survey of over 18,000 consumers in 20 countries, with 1721 being from India explores the nature of customer loyalty and how some traditional loyalty programmes, long a mainstay of customer retention strategies, may not be keeping consumers brand-faithful.
Said Harsha Razdan, Partner and Head, Consumer Markets and Internet Business, KPMG in India: “In India, brands and retailers are ready to run miles to acquire a customer. It becomes even more difficult to retain acquired consumers, unless there is a unique value proposition along with related benefits. The fact that over 55 per cent of consumers in India say they will buy from their favourite company even if it is cheaper and more convenient to buy from a rival company is further proof that loyalty endures. Loyal customers can be a reliable repeat source of revenue for retailers/brands.”
“The study in India revealed that when a consumer is loyal to a brand, 93 per cent will recommend it to their family and friends. 47 per cent will remain loyal, even after a bad experience. This substantiates that retailers today will need to re-imagine and re-invent to continue to lure/excite the new digital tech-savvy consumer. They will need to invest in creating convenient loyalty platforms, educating consumers about the program uniqueness and get the consumer to experience the benefits that the program has to offer. These programmes should make the consumer feel special, wanted and proud of being associated with the retailer/brand. Retailers/brands should continue to engage with consumers while ensuring that consumer data and interests are protected,” added Razdan.
What Indians feel:
Of the over 18,000 respondents from 20 countries, 1721 were from India. The maximum number of respondents were millennials (in the 17-36 age group).
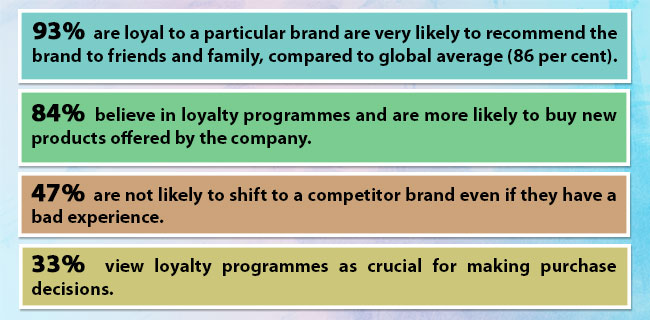
— 93 per cent of the respondents who are loyal to a particular brand are very likely to recommend the brand to friends and family, compared to global average (86 per cent).
— 84 per cent of the respondents in India believe in loyalty programs and are more likely to buy new products offered by the company
— 47 per cent of the respondents are not likely to shift to a competitor brand even if they have a bad experience
— 33 percent of the customers in India view loyalty programs as crucial for making purchase decisions
What engenders brand loyalty today?
Brand loyalty doesn’t only earn companies repeat business from their loyal customers–over 86 per cent of consumers globally, from Gen Z to the Silent Generation, say they would recommend a brand they loved to friends and family.
In terms of earning customer loyalty, 59 per cent of the consumers surveyed globally said they are loyal to their favourite brand because of a personal connection compared to 74 per cent in India. 75 per cent consumers globally said their loyalty was driven by product quality compared to 81 per cent in India, 66 per cent consumers globally as compared to 74 per cent in India said their loyalty was driven by value for money and 57 per cent consumers globally as compared to 73 per cent in India said their loyalty was driven by customer service.
Meanwhile, only 37 per cent globally see loyalty programs as an effective way to earn their loyalty. And 55 per cent of consumers who are enrolled in loyalty programmes internationally use them infrequently –a few times a month or less. 96 per cent of the millennials surveyed globally said companies need to find new ways to reward loyal customers altogether.
Here is what KPMG recommends to improve customer loyalty programmes:
Revitalise them.
Around half of the surveyed consumers globally agree that companies should find new ways to reward loyal customers. This number stood at 97 per cent for India. Responsible personalisation, emotional connection and purpose-driven causes should be key considerations.
Keep it simple.
Make loyalty programmes easy to join and simple to use. Globally, 60 per cent agree loyalty programmes are too hard to join and/or earning rewards is a challenge. 80 per cent in Brazil and China feel that way, 76 per cent in India feel this way and as do nearly seven out of ten millennials globally. Lengthy registration processes, rules and conditions, technical difficulties with redeeming awards are all likely to turn customers away.
Maintain relevance amid the noise.
Retailers need to ensure their loyalty programmes stay relevant to customers. 49 per cent of loyalty programme members globally agree they belong to too many programmes. This is particularly the case for consumers in China (72 percent), Brazil (70 per cent) and India (61 per cent). Too many programmes equate to too many apps, so it’s no surprise that customers forget their memberships, lose track of their points and perhaps decide that the rewards are not worth the effort.
Promote awareness and familiarity.
Regular communication to consumers through social channels, email or advertising can help programmes remain top of mind with consumers. More than one in three consumers globally who did not belong to any loyalty programmes globally said they were not aware of any. 17 per cent globally compared to 21 per cent in India have not joined a program. Lack of awareness (42 per cent) is one of main reasons stated by respondents in India for them not being part of any loyalty programme in India
The Indian Public Relations industry has grown manifold over the last decade. From Rs 490 crore in FY2008 and a growth rate of 7%, it is estimated to clock in Rs 1600 crore in FY2019. And the growth rate is 12%. These and other findings have emerged from the the PRCAI State of the Industry 2019 Report (Corporate Communications & In-house PR Professionals) of the Public Relations Consultant Association of India (PRCAI).
International
The report was released last week by Nitin Mantri, President, PRCAI and the International Communications Consultancy Organisation (ICCO).
Other findings of the report are in the PDF, the link to which is here:
Just last evening young Ramesh was celebrating with his family that his parents would celebrate New Years’ Eve at home with him. He still recalls how the big Independence Day holiday that he was hoping to celebrate got messed thanks to IRS 2019/Q2 being released. But alas, Ramesh’s dream of a holiday are going to be shortlived. Earlier today (December 28), at 5.08am to be precise, our inbox received the all-important communique:
The Media Research Users Council (MRUC) has announced the release of IRS 2019Q3 data. The 2019Q3 data is a rolling average of the last quarter of IRS 2017 (Q4) and three quarters of IRS 2019 (Q1+Q2+Q3). IRS 2019Q3 fieldwork covers August 2019 through November 2019.
Notes a communique: “Multimedia consumption is the order of the day with each medium holding on to their loyal consumers. Overall media reach has grown with digital leading the growth trajectory.”
In view of sample shortfall in Andhra Pradesh, the IRS Technical Committee has decided to release IRS 2019Q3 data excluding AP, as of now. The IRS 2019Q3 data including AP will be released in a fortnight’s time. Comparative analysis until then, at all India level, will not be permissible. While the reporting sample size at all India level (including AP) is 3.30 Lakh Households (Urban: 2.14L Households and Rural: 1.15L Households), without AP, the reported all India sample size will be 3.15Lakh Households (2.05L HH in Urban and 1.09L HH in Rural).
IRS2019Q3 fieldwork in Jammu and Kashmir was adversely affected because of political and administrative developments in the State (now union territory). In consultation with the IRS Technical Committee, it has been decided to report J&K data by utilising and projecting the last four quarters of IRS data i.e. Q3+Q4 2017 and Q1+Q2 2019 to the updated universe for the current round of IRS 2019Q3.
Commenting on the release of IRS 2019Q3 data, Pratap Pawar, Chairman, Sakal Media and Chairman of MRUC said, “IRS being the world’s largest survey not only reflects the ground reality in terms of print readership, but also for other media and product consumption. The stringent field monitoring system, rigorous data validation processes and the overall methodology of IRS ensures the industry gets a robust and reliable data.”
Added Vikram Sakhuja, Group CEO Madison Media & OOH, Madison World and IRS Technical Committee Chairman: “The IRS is a fascinating barometer of how India consumes Media. From this round we see that Indians consumption of media continues to grow with digital growing on top of other mediums remaining steady. I would urge all marketers to deep dive into the data. There are fascinating insights about the diversity that is India waiting to be found.”
Please click here for deck of IRS 2019Q3 Highlights
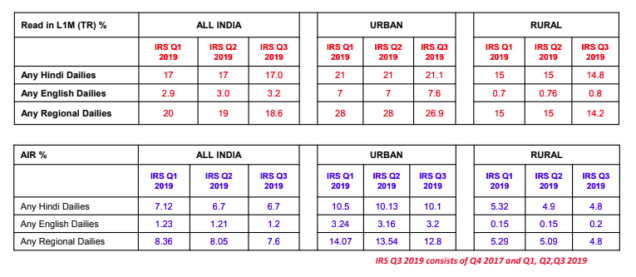
Some pointers from the all-important AIR and TR slide:
• English readership grows. Grows or stays steady in most of the country except for Uttarakhand where it has gone down by 1%
• AIR Hindi dailies All-India is the same vis Q2. Urban has degrown by 0.03%. Rural goes down by 0.01%
• AIR English dailies vis-a-vis Q2 All-India has degrown by 0.01%. Urban has grown by 0.04% and rural also by 0.05%
• Any Regional dailies AIR: vis-a-vis Q2 AIR has gone down by 0.09% in All-India. Urban has gone down by 0.06%, and Rural by 0.29%
• TR Hindi dailies All-India is the same vis Q2. Urban has grown by 0.1%. Rural goes down by 0.2%
• TR English dailies vis-a-vis Q2 All-India has grown by 0.2%. Urban by as high as 0.6% and rural also by 0.04%
• Any Regional dailies TR: vis-a-vis Q2 AIR has gone down by 0.4% in All-India. Urban has gone down by 1.1%, and Rural by 0.8%


 According to the grapevine, some global media agencies are contemplating a move to allow clients to take media and planning inhouse. Noted one report suggesting that information coming in from the UK suggest a certain large networked agency is in for a significant restructure that may possibly include the group launching a separate business to help clients take their media and planning inhouse. This would have been unthinkable even in the first decade of the twenty-first century when the media agencies went on an integration drive to offer as many services as possible from one stable to their clients.