Category: RESEARCH

  • Here’s how the various M&E reports compare…


    By Indrani Sen


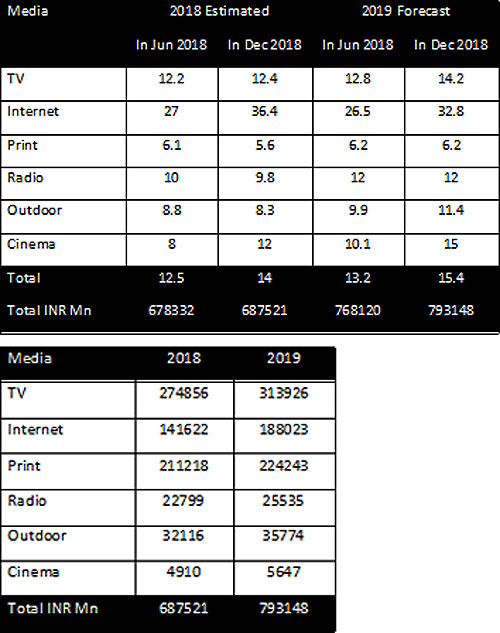
    The Media & Entertainment Industry has got another report which was released last week by KPMG, the longstanding partner of FICCI whose tie-upended in 2017 when FICCI awarded its M&E report mandate to EY. So, the Advertising and Media industry has now several reports to refer to for estimating the size and the growth of Indian Advertising Industry. KPMG has reported the following estimates and predictions for Indian Advertising Industry:


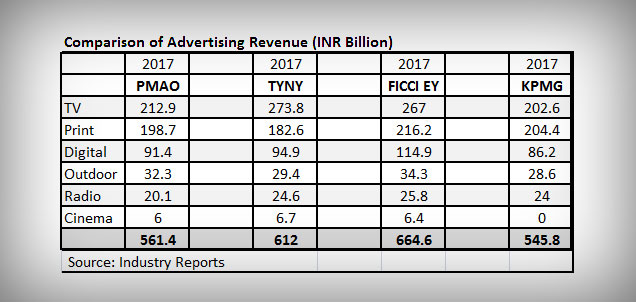
    How do these reports compare when it comes to estimating the total advertising expenditure in India? The following table will give the top line information:

    Comparison of Advertising Revenue (INR Billion)  
      2017 2017 2017 2017
      PMAO TYNY FICCI EY KPMG
    TV 212.9 273.8 267 202.6
    Print 198.7 182.6 216.2 204.4
    Digital 91.4 94.9 114.9 86.2
    Outdoor 32.3 29.4 34.3 28.6
    Radio  20.1 24.6 25.8 24
    Cinema 6 6.7 6.4 0
      561.4 612 664.6 545.8
     Source: Industry Reports    

    The above analysis shows us that TYNY and FICCI reports estimates are in one bracket with PMAO and KPMG reports in another bracket with a large gap in estimates between the two brackets. For two consecutive years, the TYNY and PMAO reports were released during the same week in January. TYNY closed the estimate for total ADEX 2017 at Rs 61,263 crore with a growth rate of 10% over 2016and PMAO showed a growth rate of 7.4% in 2017 over 2016 and estimated the total ADEX as Rs 53,138 crore in 2017.

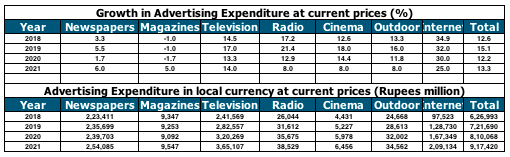
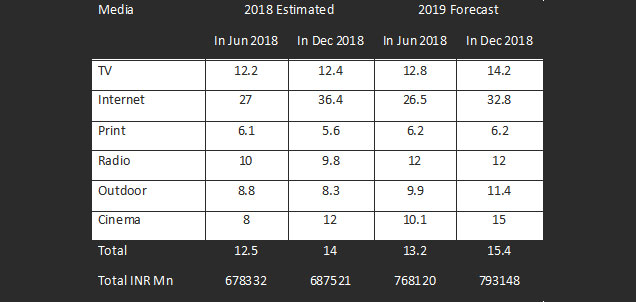
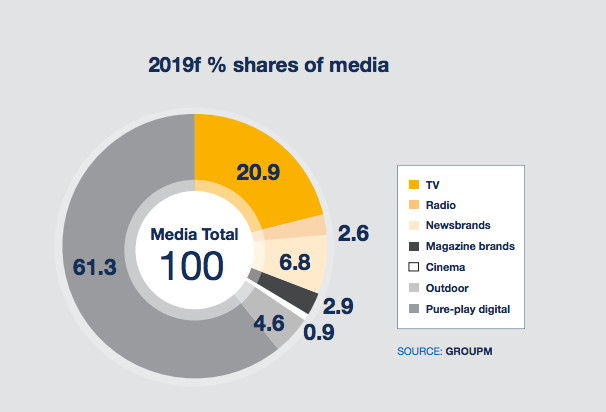
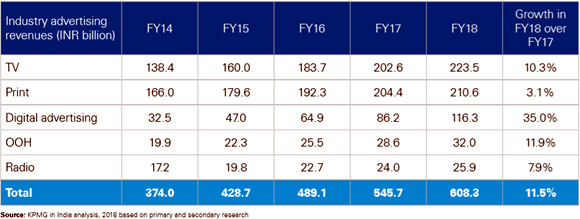
    Digital is going to have the highest growth in ADEX as perthe two studies, 30% according to TYNY and 25% according to PMAO. KPMG has pegged the Digital growth rate even higher at 35%. Both reports predict 13% growth in TV AdEx and 4% (TYNY) and 5% (PMAO)in Print AdEx. KPMG has reported lower growth rates for both TV (10%) and Print (3%).

    PMAO and TINY both agree that the highest growth after Digital will be achieved by Cinema (20% TYNY & 14% PMAO) which has the smallest share of the advertising pie. The FICCI EY 2018 report shows statistics for cinema industry revenue from domestic theatrical, overseas theatrical, cable and satellite rights, digital/OTT rights, in cinema advertising and home video.  KPMG has not been reporting in cinema advertising in FICCI reports over the last few years as they have been clubbing it with digital/OTT rights and home video as ancillary revenue stream and they have continued with that trend in their own report. As the FICCI EY report 2018 has shown the detail break ups and I have taken the liberty of using the in cinema advertising revenue as a part of FICCI-EY total advertising projection. However, the growth rate cannot be estimated without access to KPMG’s research data.

    Both have shown similar percentile growth rates for OOH and Radio (15% TYNY & 10% PMAO). The KPMG report also predicts good growth rate for OOH (12%) and Radio (8%). The FICCI report and the Group M report are closer in terms of overall projections, but they differ in details but more or less agree about trend of growth in digital media.

    Before KPMG, we also had the DAN Report with estimates closer to PMAO and now KPMG. The Pitch Madison report and the DAN report are closer in terms of overall projections, though they differ in details, particularly in case of digital media


    Source: DAN Report 2018

    The gem of an insight which KPMG has been able to mine and share with the Advertising & Media Industry is reflected in the following quote: “This year, we saw telecom-media-technology (TMT)convergence take centrestage and the emergence of media ecosystems…. media companies need to take a relook at their strategies and business models to successfully operate and thrive in the new paradigm.”

    This insight adds a tremendous value to the KPMG 2018 report and warns the industry about the significant changes which we are going to experience about how media is created, distributed and consumed by Indian consumers.  We will not be able to borrow a business model from another country, as the Indian model will be unique. Our law makers, particularly TRAI needs to tighten their belts and churn out rules and regulations capable of dealing with the changes in media consumption along with the ongoing changes at a pace which will keep pace with the TMT convergence.


    The KPMG report and executive summary can be accessed at :https://home.kpmg.com/in/en/home/insights/2018/09/india-media-entertainment-convergence-report.html


  • Indians’ trust in politicians and media is declining: Ipsos survey


    By A Correspondent


    According to a new survey by Ipsos and as a part of the long running series on misperceptions of social realities – The Perils of Perception –more number of Indians think that fake news, filter bubbles and post truth are something that affect all people in general. Notably, the survey further shows our trust in politicians and media declining.


    The study of over 19,000 people in 27 countries shows that the majority of Indians say that they regularly see fake news and half of them said that they believed a fake story, only to discover later that it was fake.


    The survey shows that 74% Indians think that the average person in India lives in a bubble on the internet, mostly connecting with people like themselves and looking for opinions they already agree with. Only 55% Indians think that they themselves have the same tendency of living in the bubble.


    Unlocking Fake News

    70 per cent of Indians believe that they can tell real news from fake news, and less number of Indians think (56%) that the average Indian can tell the difference between the two – having less faith in the average person.

    When it comes to Fake News, 72% Indians profess to have seen news stories by media organizations deliberately saying something that wasn’t true. And 55% Indians say that they had falsely believed a news story as real until they found out that it was fake.

    Interestingly, Indians interpret Fake News in different ways: 55 per cent Indians say Fake News are stories where the news outlets or politicians only pick up facts that support their side of the argument; 53 per cent say Fake News are stories where the facts are wrong; 36 per cent Indians feel it (fake news) is a term politicians and the media use to discredit news they don’t agree with.


    Why are our perceptions misplaced?Why do we get it wrong?

    Indians blame it on multifarious factors that we get facts wrong about our country, how they are changing, what proportion of the population are immigrants, whether crime is rising or declining:56% blame politicians for misleading people; 47% believe that it is the media that is misleading people; 44% feel social media is the culprit for people’s lopsided views; 43% Indians think people per seare biased in their view of the world and tend to focus on negative things – they think that things are getting worse or sometimes they generalize from their own experience; 25% Indians blame it on the figures being wrong and exonerate people’s views for it; and 21% Indians blame it on the inherent discomfort with numbers, that people have, that warps the estimates.


    Said Parijat Chakraborty, Executive Director, Public Affairs: Fake News is a menace that can have serious repercussions unless we stop spreading and producing these. Common people are not generally producing fake news but everybody can contribute in stopping the spread of it. All it takes is a second of pause to assess the piece of news with rational logic.  And this is made more dangerous because we have an in-built tendency to think that we’re better at spotting lies and understanding reality than other people.   This pushes us to think that fake news, filter bubbles and post-truth are other people’s problems, not ours.  But the results of the survey show that these are a real concern for many people. We think things are worse now than in the past – and this is reflected in our view of decreasing trust in politicians and perceived increases in political and media lying.  But the reality is, in India we have seen people berating the previous governments for their lacklustre performance as well. What we should worry about is the decline of trust in politicians and media.”

  • Innovate, but responsibly


    By A Correspondent


    WE Communications has released results from its Brands in Motion 2018 global study. The data revealed that consumers worldwide(including in India) continue to demand innovation — but now, in response to increasing technology-based fears, they’re attaching strong new stipulations to these expectations, chief among them the requirement that brands use technology ethically and responsibly.


    “We are seeing some compelling year-over-year shifts in customer attitudes,” said Melissa Waggener Zorkin, CEO of WE Communications. “Consumers continue to have high expectations for brands to use innovative technologies, but most are afraid of how those same technologies might disrupt their lives. These fears are causing consumers to demand greater accountability from brands.”


    The study, conducted across eight global markets, examined both rational and emotional drivers that motivate customer choices within today’s environment — to decipher brand movement relative to geography, industry and key stakeholders. Three key themes emerged:

    Consumers hold brands accountable to use technology ethically

    Across the board, consumers indicated they continue to have high expectations for brands to use technology to drive innovation: nearly 50 percent of Brands in Motion 2018 global study respondents believe technology will either help do more things in less time or create greater sustainability. However, this year’s study also exposed a new precondition to consumer expectations: 97 percent said they now place responsibility squarely on brands to use technology ethically while continuing to drive customer-centric innovation.


    Consumers have been shaken by recent technology scandals and are anxious about the promises of unprecedented innovation. Eighty-four percent fear their personal data is not secure, 67 percent dread being a pedestrian in a world of self-driving cards and 54 percent worry artificial intelligence will take their jobs away. In fact, 94 percent said that if brands can’t use technology ethically, then governments should step in. Consumers are giving brands an ultimatum: Self-regulate or be regulated. 


    Movement on the matrix: consumers want brands to show, not tell

    From 2017 to 2018, average global scores of brand motion were up 16 percent for rational drivers and 14 percent for emotional drivers, showing that consumers’ need for reason is outpacing their need to feel emotionally connected to a brand.In short, consumers are insisting brands deliver proof over promise.

    When mapping these changing perceptions using WE’s Brands in Motion diagnostic tool — the Motion Matrix —the study revealed a notable uptick across every market but one, indicating customer expectations continue to grow at an exponential rate and it’s harder for brands to wow and delight consumers both emotionally and rationally.


    Categories were not immune to these shifts. Computing devices, which previously had the highest consumer admiration, fell dramatically. In contrast, smart home — the category that seems like it would have the most to lose in conversations about tech disruption, data privacy and security—is ascendant. Despite 63 percent of respondents saying they were afraid their phone was listening to them, and 84 percent fearing their personal data wasn’t secure, smart home made huge year-over-year gains in 4 of the 6 markets in which it was surveyed.


    Collectively the data signals that although the tech halo is strong, consumer anxiety over disruptive technologies and reactions to technology misuse may be stronger. These fears could continue to be a negative influence on tech-heavy categories unless they start to anticipate and get ahead of consumers’ ethical expectations.


    Global environmental forces drive increasingly polarized perceptions of brands

    With the prevailing societal backdrop of trade tensions, political unrest and technology angst, consumers are raising expectations for greater rationality and responsibility in their relationships with brands. Not only are people expecting more from brands than ever before, they are also more binary in their reactions to brands and categories.


    The studyfound that in 2018, brands and categories are primarily clustered in two quadrants of the Motion Matrix —mover and defender—and the higher average scores mean it’s harder than last year to be a mover. This shift indicates that consumers around the globe are reserving their greatest love and appreciation for a smaller number of brands, and that they have strong convictions—one way or the other—about both sectors and brands. As a result, the issue of brand value has become very stark and polarised, making it harder for competitors of a beloved brand to draw their share of consumer affection.


    “Consumer sentiment isn’t surprising if you look at the current global environment — from Facebook’s Cambridge Analytica scandal, current struggles with content moderation and the GDPR, to the competing promise and apprehension attached to technologies like AI, blockchain and autonomous vehicles,” said Alan Vander Molen, WE’s president of international. “Brands have become the middle man, keeping the peace between lightning-speed innovation on one side and thoughtful ethics and regulation on the other. Consumers have now upped the ante and expect them to do more to drive stability in progress.”


    “The Brands in Motion 2018 global survey data and corresponding insights present brands with a tremendous opportunity,” said Kass Sells, president of North America, WE. “With awareness of how customer perceptions, attitudes and demands have changed year over year, they better understand the forces of motion, their corresponding impact, and where they can capitalise to better reach their most important stakeholders.”


  • Top 5 Print Advertisement Layout Innovations – Diwali 2018: AdEx India

    By A Correspondent


    Diwali every year offers an excellent opportunity for advertisers to innovate in newspapers for their advertisements. While front-page jackets are still very popular, there’s a lot more that was tried and tested this year.


    We got this data from AdEx India, a division of TAM Media Research. The media is print, and the period is October 1 to November 5, 2018.


    Note: the Ranking is based on percentage share.


  • Hindi GECs: Mixing It Up… Finally!


    By Shailesh Kapoor


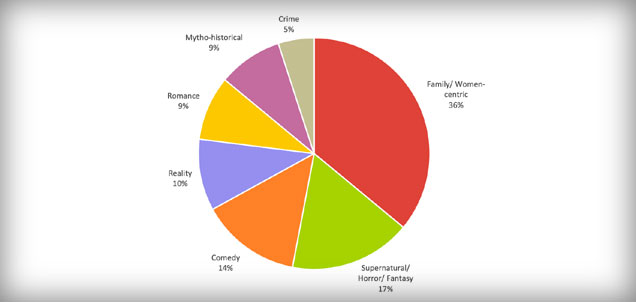
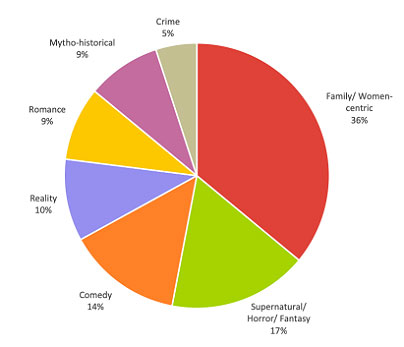
    While all eyes this year have been on the OTT/ digital space, the Hindi GEC category too is silently, but surely, going through a shift this year. One doesn’t need to look much beyond the evolution of the programming mix on the category to understand this.


    After the launch of eight new shows currently in pre-launch promotional stage, the genre mix of the category, based on 64 primetime shows across the seven Hindi GECs targeting Urban HSM, will look something like the following:


    The family/ women-centric + romance combination, which has traditionally dominated the category since 2000, controlling at least 65-70% of the programming mix, and peaking at 80%+ at times, now stands at a modest 45%. The ‘alternative’ genres are no longer alternatives, with 55% contribution to the programming mix as a collective. This is the healthiest the Hindi GEC category’s programming mix has looked in a long time.


    This change, evidently, is a result of the distress the category has faced over the last two-three years. With category share (as a percentage of total TV viewership) dropping consistently, Hindi GECs were left with little choice but to question if conventional family dramas and love stories are the path to sustained viewership. The rise of the alternative has been evident through shows like Naagin, Kaun Banega Crorepati, Comedy Nights With Kapil/ The Kapil Sharma Show and the ilk putting up solid numbers over time, even as conventional family dramas failed to make an impact, barring a select few.


    This shift makes 2018 the best year for Hindi GECs in recent times. While we are still five weeks of data away from doing an annual analysis, it is safe to say that there has been no further attrition in the category’s share this year. While that’s a good start, a lot more needs to be done. After all, two years of damage needs to be undone.


    The sinking ship in this mix is still the family drama genre. Most shows that are doing well in this set are pre-2015 launches. Very little that has launched since then has managed to survive more than a few months. More importantly, it is this 36% (amounting to 23 shows out of 64) that brings a perception of mediocrity and lack of innovation to the genre in the viewers’ minds. This year’s launch Kullfi Kumarr Bajewala provided an exception, emerging as a fresh yet relevant show in this mix. But as it moves ahead and enters its second year, it will have to face similar challenges as other family dramas too, those related to viewer fatigue coming from a long-running show.


    The ‘overdose’ of supernatural, fantasy and horror shows in the category is a popular topic in the media, with Naagin being the flagbearer, albeit not in a flattering way. But if 11 shows (17% of the mix) can deliver more category freshness and entertainment than 23 conventional dramas, why should that be a problem of overdose?


    I’m glad there would be something to write about in the traditional end-of-the-year Hindi GEC round-up in this column. The last two years have been too inert to write much. This year is better. Can 2019 then be the year when some of the glory, from the pre-2012 days, is won back?


  • Isobar launches ‘Augmented Humanity: Isobar Trends Report 2019’

    By A Correspondent


    Isobar has released ‘Augmented Humanity: Isobar Trends Report 2019, an exploration of five digital trends for 2019. The report explores the extent to which humanity will work in harmony with technology to expand and enrich life in 2019.


    Written by the innovation and strategy experts across Isobar’s 85 offices in 45 markets, the report builds on the concept of Augmented Humanity, developed by Isobar in 2018. The 2019 trends report explores the changing nature of the human relationship with technology: from how we work and play, to how we travel, shop, spend our leisure time and engage with brands.


    The report is centered around a belief that technology augments our experience of the world, allowing us to work more efficiently, to live healthier lifestyles, to make better human decisions and to expand our creativity. It explains why Isobar believes that this is an important moment in human history, outlines some of the myriad opportunities that these technological developments open up and shines a light on some of the challenges posed by digital disruption.


    The annual report provides guidance on navigating this new landscape to keep businesses and brands ahead of the curve for 2019 and beyond. Each chapter outlines why these developments are important, key examples of the trends in action, why businesses need to be aware of them, and how they can take advantage of their positive potential.


    Said Jean Lin, Isobar’s Global CEO: “Technology today plays a key role in driving relevance, scale, and elevating human experiences. It is our job to harness its wonderful power and the potential for businesses and brands, in serving people better in the age of Augmented Humanity.”


    Added Shamsuddin Jasani, Group Managing Director, Isobar South Asia: “We need to embrace the power of technology. Today, we are on the edge of an augmented age where technology is redefining the possibilities of what a human can truly be capable of. This next phase of transformational technological advances, wearable and embedded devices will unlock human potential by tapping into almost all our day to day activities. In 2019, we shall see how digital is going to be omnipresent and VOICE will be the biggest game changer in the field of marketing.”


  • Achche Din…! Zenith forecasts 15% AdEx growth in 2019


    By A Correspondent [to be updated by 9.30am]

    Media agency network Zenith forecasts that adspends for India in year 2018 will close at Rs 62,699 crore. And the total AdEx for India will see an increase of 15% and climb up to Rs 72,169 crore in 2019.

    India remains one of the fastest growing economies, with strong GDP growth of over 7%, led by reforms in sectors such as retail, infrastructure, manufacturing and services, notes a Zenith communique, adding: “Given that a significant part of the population is below 30 years of age, there is likely to be continued consumption-led growth with less reliance on export-led momentum.  This should give a boost to businesses across the board, ad investments and government initiatives.”


    Furthermore, the release adds: “However, 2018 has also seen the depreciation of the rupee and oil price volatility. The overall expectation is that oil prices will stabilise, giving Indian consumers more disposable income. Indian consumer confidence continues to remain relatively high. “

    According to Tanmay Mohanty, Group CEO at Zenith, many parts of India were experiencing digital transformation, led by mobile. This will accelerate categories such as banking, financial services, healthcare, entertainment and sports, travel and lifestyle. “2019 is the year of the Indian General Elections. These and the State Elections will boost marketing spends.  Additionally, the Cricket World Cup and the Indian Premier League will drive growth.” Mohanty said.

    “Digital will continue to accelerate both in reach and consumption.  Television – linear and catch-up will be on an upward curve. The expectation for radio is that it will digitise aggressively in response to streaming services while both cinema and out of home (OOH) will innovate and increase reach-led investments. Print will thrive on regionalisation.” Mohanty added.

    According to a similar report released last year (Dec 4, 2017), total AdEx for India was estimated to climb up to Rs 58,422 crore, growing  at 8.4% in 2018, led by television. This estimated has been bettered by the figure of Rs 62,699 crore as quoted earlier for adspends in 2018.

    Meanwhile, online video and paid search are driving the growth in global adspend, as advertisers focus on personalised and targeted communications, according to Zenith’s Advertising Expenditure Forecasts, published today (December 3).

    This is what the rest of the summary, as provided to the media, notes:

    With advertisers now able to use these channels to target with pinpoint accuracy and serve personalised messages, they are increasing both the efficiency and effectiveness of campaigns. Between 2018 and 2021, online video advertising will grow at an average of 18% a year, twice as fast as other forms of internet display advertising and well ahead of any other channel.

    Paid search is not growing as quickly in percentage terms – it will grow at an average of 7% a year over this period – but in dollar terms will contribute even more to global growth than online video. The application of AI techniques, better location targeting, integration with commerce and the rise of ‘in the moment’ search are all making search more effective for advertisers. We forecast that between 2018 and 2021, online video advertising will grow by US$20bn, while paid search will grow by US$22bn. Between them these two channels will account for 60% of the extra ad dollars added to the market over this time.

    Online video and television are more important to brand-building than ever

    Advertisers commonly use online video together with traditional television, combining television’s broad reach and immersive experience with online video’s ability to target and optimise frequency. Taken together, these two media are becoming more important to advertisers’ brand-building campaigns. Their combined share of adspend in ‘display’ media (i.e. all media except paid search and classified advertising) has risen from 46.2% in 2012 to 48.4% this year. By 2021 we expect television and video to have a combined 48.8% share of global ‘display’ – a higher share than television ever achieved on its own. Taken together, television and online video are working harder for advertisers than ever before.

    Global e-commerce advertising starts to accelerate

    E-commerce advertising – advertising that sits alongside and within search results and product listings on e-commerce sites – is well established in China, but is only just starting to get going globally. Zenith believes it has the potential to transform the way brands convert customers online, and add about US$100bn of new money into the global advertising market.

    E-commerce advertising has risen from 0.8% of all adspend in China in 2009 to an estimated 18.2% this year, driven by investment by companies like Alibaba in turning e-commerce into advertising revenue. Until recently, e-commerce platforms outside China have largely focused on direct sales to consumers at the expense of advertising, but that is now changing. Amazon generated nearly US$5bn in advertising revenue in 2017 as a whole, and in Q3 2018 its ad revenues grew by 122% year on year. Other shopping platforms are following suit by investing in their own advertising activities.

    Globally, e-commerce advertising is about as advanced as it was in China at the end of the last decade. Amazon accounted for 0.8% of global adspend in 2017, the same proportion that Chinese e-commerce occupied in 2009. If e-commerce follows a similar path globally to the one it followed in China, it could account for 18% of global adspend by 2027. That’s equivalent to over US$100bn in today’s ad market, representing a huge revenue opportunity for the platforms, and a whole new way for brands to reach customers at the point of purchase. This money typically comes from brands’ commercial teams rather than their marketing teams, from budgets set aside for negotiating with retailers. It is therefore new money to advertising, and should expand the market without cannibalising money spent elsewhere.

    Steady growth in global adspend to continue

    We estimate that global advertising expenditure will grow 4.5% by the end of this year, boosted by the Winter Olympics, FIFA World Cup and US mid-term elections. Growth will then remain steady and positive for the rest of our forecast period to 2021, at 4.0% in 2019, 4.2% in 2020 and 4.1% in 2021.

    Central & Eastern Europe will be the fastest-growing region, with average growth of 6.3% a year between 2018 and 2021, driven by continued strength in Russia, which is growing at 6.8% a year and accounts for 39% of the regional total. Asia Pacific is next, growing at an average of 4.9% a year, or 5.7% a year excluding Japan. India is the stand-out growth market here, growing at 13.5% a year from US$9.7bn in 2018 to US$14.2bn in 2021, when it will become the world’s eighth largest advertising market, entering the top ten for the first time. India has huge potential for further growth, with advertising taking up just 0.3% of GDP, less than half the Asia Pacific average of 0.7%

    Young advertising markets like India are playing an ever-more-important role in driving global growth in adspend. ‘Mature’ markets – by which we mean North America, Western Europe and Japan – account for 62% of global adspend this year, down from 75% ten years ago. ‘Rising’ markets – by which we mean all markets apart from the ‘Mature’ ones – will contribute 54% of the growth in global adspend between 2018 and 2021, increasing their share of global expenditure from 38% to 40%.

    “E-commerce advertising is poised to transform the advertising market in much the same way that paid search did in the last decade,” said Jonathan Barnard, Zenith’s Head of Forecasting and Director of Global Intelligence. “It could bring US$100bn in new money into the market over the next ten years.”

    “Brands are transforming their businesses to take advantages of the new digital opportunities available to them,” said Vittorio Bonori, Zenith’s Global Brand President. “Better segmentation and targeting, personalised creative and direct transactional relationship with consumers are combining to drive brand growth.”


  • 14.3% adspend growth forecast for 2019: GroupM


    By A Correspondent


    Okay, we’ve cheated. We know GroupM publishes a propah India-specific report in Februrary, but we’ve noticed over the years that the global This Year Next Year report released in Decemeber is also fairly detailed.


    So while we carry the report now, please do note that there may well be a full-blown one in the coming months. So here’s the report:


    “The IMF expects real GDP to grow 7.4% in 2019 (12.1% nominal), driven mainly by services and private consumption; manufacturing and agriculture are likely to see moderate and low growth, respectively. Bank balance sheet repair and GST reform is likely to start yielding results sometime in 2019, accelerating a reviving investment cycle, but downside risks remain: continued global trade conflicts and high oil prices are likely to impact the exchange rate, trade deficit, liquidity and inflation.


    Auto advertising growth is expected to be high, as car, scooter, luxury bike and commercial vehicle segments will see good sales growth in 2019, driven by urban demand and infrastructure spending. Rural-led motorcycle sales will be monsoon-dependent.


    BFSI adspends will be moderate to high, as bank adspends remain subdued but insurance and financial services spend robustly to expand penetration, with the government-led health insurance scheme also providing a boost to growth. Digital payments are expected to touch $500 billion by 2020, and insurance to be a $280 billion sector by 2020.


    Consumer durables ad monies will see moderate-to-high growth: low penetration in consumer appliances, shorter replacement cycles in consumer electronics, robust replacement demand overall and unexpected/extreme weather – hotter summers, hazier winters – will all contribute to spends.


    E-commerce adspends will grow fast: a report cites the sector to touch $100 billion GMV by 2020, while Morgan Stanley predicts it to touch $200 billion by 2026 and expects ~50% of India’s internet users to have matured by 2019/20 (five years or more of internet use). Online shoppers are expected to increase from the current 14% of internet users to 50% by 2026. Strong consumer expenditure growth should lift Retail advertising in the order of 12-14% year over year between 2017 and 2020, and the explosion of modern retail, expected to nearly double in size between 2016 and 2019, will drive ad monies.


    FMCG adspends will grow fast, as key drivers remain strong: expanding rural penetration, strong rural demand supported by increased welfare spending in a busy election year in 2019, and steady urban sales and growing interest in luxury and health-wellness products.


    Services ad growth should be strong, as the major segments of travel and hospitality, health care and logistics are all expected to perform well in 2019. The travel market is tipped to reach $40 billion by 2020; logistics are expected to hugely benefit from GST.


    Telecom ad growth will be driven by mobile handsets. 2017 saw 288 million shipments (124 million of which were smartphones). The IDC predicts mid-teen growth in 2019-2020, led by low-priced handsets. Telco spends will be conservative, as incumbents face continued pressure on margins due to intense competition – likely to continue till ~2020.


    TV: sports and elections will drive advertising. Print to grow at a slower rate, losing share to digital; election spending will provide some relief. Radio is expected to do well from auto, mobile handsets and a revival in FMCG, real estate and government spends. Cinema & outdoor will continue to grow, as technology adoption improves ad visibility and from the growth of organised retail. Digital: will see high double-digit growth backed by video (with OTT players/AVOD gaining traction) and other premium inventory.”


    And here’s the final analysis:


    “It will be a toss-up with China for 2018, but this year and next India could remain the world’s fastest-growing large economy, with only the Philippines on its heels. Despite two successive quarter-point repo rate rises in 2018 (to 6.5%), the rupee has depreciated 10% versus the US dollar in the year since our December 2017 forecast, in line with the average of the currencies in our country set. The rate rises were a response to CPI creeping up, and there may be more to come. This reflects the health of India’s domestic demand: like the USA, it is a relatively self-sufficient, low-trade economy, which is a strength when global trade is contracting. HSBC predicts India’s consumer demand growth will peak at an impressive 9.1% (real terms) in 2018 before moderating to around 7%, which only China is likely to beat. However, no country is immune from the demand-sapping effect of pricey oil and a runaway dollar, which would only encourage capital flight from the developing world back to the rising-rate USA.”


    And here’s how India fares in the global perspective:


    India’s prospective 2019 growth this year is the same order as Australia, Russia and Brazil combined, even though India’s ad economy is only a quarter of the others’ combined heft. Such is the arithmetic of 14% ad investment growth with its roots in 7% real growth in India consumer spending (after 9% in 2018).


  • Magna Global too forecasts Achche Din: 15.4% adspend growth in 2019


    India faced headwinds from two successive regulatory distractions in the form of de-monetization (Nov 2016) and Goods & Service Tax (July 2017). This held back the economic growth to 6.7% in 2017 (8.2% in 2015 and 7.1% in 2016) and its lingering effects continued in the early parts of 2018. With the negative impact fading, the economy is on the recovery mode and IMF has forecast a growth of 7.3% in 2018 and a consistent 7+% growth till 2023 in its October 2018 report. Advertising expenditure per capita continues to grow from ₹ 515.3 in 2018 to ₹ 586.7 in 2019.


    Said Shashi Sinha, CEO, IPG Mediabrands: “India is the only market in the world where Print continues to be dominant and is growing in all aspects – circulation, readership and geography. The medium is growing strongly on the back of language which has led to the growth in the number of language newspapers. Secondly, print is growing because of the credibility it offers in this era of fake news. There is no denying that there are platforms causing strain on Print but the attributes of well researched, in-depth content and authenticity can only be endorsed by Print and that makes the medium more credible and hence relevant for advertisers. In 2019 print will further emerge as a dominant force because of all the state elections and the general election and we expect the growth rate to be higher than 2018.


    2018:+14%

    Good monsoon backed by minimum support price for crops boosted consumption in rural markets. Consumers got the benefit of lower tax incidence post GST. Digital access got easier and device penetration made a significant positive impact on sectors like e-commerce, auto etc. This growing consumption is attracting the attention of the marketers. Measurement of rural media consumption by BARC and IRS is encouraging advertisers to invest. With economic activity resuming full throttle, overall industry is brimming with positivity and all sectors including Media and Entertainment has shown buoyancy and growth.


    Marquee events like IPL was a major revenue spinner despite aggressive acquisition cost. Extended festive period helped advertisers justify higher marketing investments. Magna estimates the ad market in 2018 to accelerate further compared to previous estimates and exit with a +14% growth (+1.5% higher than June 2018) notwithstanding the restraint caused by the natural calamity in southern part of India


    2019:+15.4%

    Digital is stimulating overall growth.  High-speed broadband and online video is driving elementary changes.  Though it is still a duopoly of Google and Facebook attracting >70% of the revenue, this will change the balance as OTT and E-commerce ad platforms are gaining scale and are increasingly attracting advertising monies. Advertiser’s confidence in the medium is very strong despite Face Book’s strategy to declutter ads on news feed followed by a rate increase and YouTube doubling rates for their premium assets. The market share of Digital will go up from 21% to 24% of total advertising spends with revenues touching ₹188 Bn in 2019.


    Added S Venkatesh, SVP, Magna India: “Digital is leading with +32.8% growth in 2019. Massive expansion in smartphone usage is shifting the consumption from collective to discrete. Streaming video will be the biggest gainer in terms of format and is estimated to double its revenue in 2019. Total revenues will grow from INR 687.75 Bn to INR 793.1 Bn.


    Television has immense headroom to grow with 34% of the homes still being Non-TV as per BARC. While organic growth is absolute, cyclical events like ICC World Cup and National elections will generate strong advertising demand. Healthy distribution realisation with digitization gaining momentum will reduce dependence on advertising and aid broadcasters demand better yield. Despite digital growth, TV continues to be dominant as it enjoys unmatched tor of audiences. With 40% allocation of advertising spends, TV will expand+15.4% in 2019 and will continue to grow CAGR +12.5% till 2023


    Print: Physical news delivery compared to global trend of negative growth has grown CAGR +1.9% in the last 5 years till 2017 as per ABC. Also the fact that readership has grown across age groups establishes print’s dominance, relevance and growth. English newspapers are facing stiff competition from Digital platforms and this drop in readers is offset by the growth in languages. Publishers are also gearing up to move beyond pure-play print revenue stream.  Print will attract a larger pie of the political campaigning and Government spends because of elections. Real Estate and Education advertising reaching its earlier peak will help achieve growth of +6.2% in 2019.


    “Lot of investment is going on Print digital properties including Google’s product Navlekha. The digital edition measurement from IRS when reaches scale will help publishers monetize both forms of readership”, added Venkatesh.


    Radio segment is facing surplus inventory because new station launches, in addition, music streaming apps have become easy to access because of fall in data prices. Fearing drop in listenership base, radio stations have cut down advertising load to increase engagement.  While some of the networks have been able to increase rates, this approach is affecting topline growth with advertising revenue witnessing a jump of +12% in 2019. Automobile, finance, real-estate and E-commerce are primary contributors to growth with Government and political spends increasing during the election window


    For OOH it will be a promising year with major contributions from OTT and Mobile Apps along with Telecom and E-commerce. Government’s promotion of welfare schemes and Election spending will sustain this momentum. Estimated to recover with a +11.4% growth the category continues to be data scarce and shall hold 4-5% share of total spending.


    Key Figures:

  • So where do adspends on print stand vis-à-vis TV & digital for 2019?


    By A Correspondent


    So where do adspends on print stand vis-à-vis TV & digital for 2019? Earlier this month, GroupM’s TYNY (This Year Next Year) report threw up some interesting data forecasting adspends for 2019 and more.


    We have pulled these pie charts from the TYNY report released by GroupM. Read on… the charts tell the story.


    US


    Brazil


    Canada


    China


    Germany


    India


    UK
  • Marketing Trends for 2019


    By A Correspondent

    Warc has released its Marketer’s Toolkit 2019, an annual report outlining the priorities of, and challenges facing, brands in the year ahead and how to address them.

    The report centres on a global survey of more than 800 senior marketing and advertising professionals and dives into the implications of the challenges facing advertising from strategy, technology, and media perspectives.

    “The Toolkit reports of the last two years have been dominated by technology trends; 2019 feels different,” said David Tiltman, WARC’s Head of Content, adding: “It feels like a year of getting the fundamentals right, and using tech where necessary to achieve that end. Brands clearly view ‘experience’ as a form of competitive advantage – and the tech that can help them improve customer experience across channels is being prioritised.”


    Strategy:

    ‘Experience’ will drive the marketing agenda, and shape tech investment The global Marketer’s Toolkit survey and CMO interviews reveal that marketers see improved customer experience – both online and offline – as a key growth lever in addition to a route to strengthening trust in brands. Crucially, the disruption of several categories by direct-to-consumer brands comes up again and again as a concern.

    Almost two thirds (61%) of agencies and 52% of brands cited CX as the most important digital transformation for business in 2019. There is still some way to go, however, as just 15% of brands say their CX is aligned across channels.

    “Always go back to understand the customer,” said Uniqlo China’s CMO, Jalin Wu. “The customer is our need. We are not just presenting ourselves as apparel, we are presenting ourselves as a solution for people to have a better life.”


    Technology:

    Voice is piquing marketers’ interest increasingly, principally in terms of voice search. Just under a third (29%) of brands named voice as a priority for 2019, up 12 percentage points from last year. “Like most big marketers and advertisers, we’re looking at the role of voice and how we can continually make that user experience a whole lot better,” Tourism Australia CMO, Lisa Ronson told WARC.

    In response to the rise of e-commerce, there is also growing interest in payment technology, as more and more brands look to sell more online.

    One of the biggest shifts observed in the report concerns Augmented and Virtual Reality. Just 23% of marketers named the channels as a strategic priority for the year: a drop of 13 percentage points compared to last year’s report.


    Media:

    The overwhelming majority of marketers (79%) expect to increase their online video budgets. Elsewhere search and mobile advertising expect to see continued investment. It is thought that Facebook’s Instagram and Alphabet’s YouTube stand to benefit from this interest. Snapchat meanwhile is expected to see cooling interest from marketers.

    A key winner of the new media landscape is the e-commerce (and soon to be advertising) giant Amazon, toward which 69% of marketers expect to funnel increased spend.


  • WARC Global Advertising Trends – TV at a crossroads


    By A Correspondent


    Linear TV, inclusive of real time and catch up viewing, remains by far the top medium for global display advertising spend, attracting over $140bn ad investment in 2018 – more than double mobile internet in second place on $58bn.

    Linear TV’s core strength is reach, and whilst daily viewing time has fallen worldwide in recent years – coinciding with the steady rise in internet penetration – advertiser demand has not diminished.

    As the industry looks ahead, despite the challenges, addressable TV – the ability to show different ads to different households based on consumer data – may be where future growth lies.


    TV continues to dominate global display adspend but its share is falling

    Linear TV is estimated to have accounted for 41.9% of the total display advertising investment this year, or $140bn, in WARC’s 12 key markets -Australia, Brazil, Canada, China, France, Germany, India, Italy, Japan, Russia, UK and US. This represents a rise in spend of 1.0% from 2017 and a share 25.1 percentage points (pp) ahead of the second-largest display medium, mobile internet.

    However, linear TV’s dominating position has been eroding since 2009, mostly at the expense of mobile, which has grown 16.6pp since then.


    TV’s reach is unparalleled, making it high in demand from advertisers despite viewing times decreasing

    TV’s core strength is reach, and its function to facilitate top-of-funnel building, which it does far more effectively than other media, especially over the long-term. Data collated by The Global TV Group from national monitoring organisations show that TV reaches 96% of individuals in key markets each month, and 71% each day on average.

    But daily time spent viewing linear TV has fallen worldwide in recent years – it registered one hour 54 minutes during the first half of 2018, down four minutes from 2017 and 21 minutes from 2012 – coinciding with a steady rise in internet penetration.

    The decline in linear viewing has not, however, led to a reduction in advertiser demand. This has driven up spot cost-per-thousand (CPM) in all key markets this year, ranging from rises of 14% in India, 4% in the US, 2% in the UK to 1% in Japan.


    TV takes almost two-thirds of brands’ successful, high-budget campaigns

    WARC’s Media Allocation Report, which draws from campaign data from over 15,000 case studies, shows that successful, high-budget campaigns invest more in TV while the proportion of budget allocated to digital decreases. Globally, successful brands in the alcoholic drinks and financial services sectors are the biggest spenders on TV.

    In the UK, research has shown that, in the long-term (over three years), TV advertising is responsible for 71% of total ad-generated profit and in the short-term (three to six months), TV ads are responsible for 62%. In both cases, TV accounts for the largest share of profit when compared to other media.


    TV’s effectiveness is undervalued

    Despite research by the Advertising Research Foundation (ARF) showing that sales returns dip $3 for every $1 reduction in TV advertising, and data from Ebiquity showing that TV ranks as the #1 most effective ad medium, 32% of brands responding to WARC’s recent Marketer’s Toolkit survey stated they intend to cut TV investment in 2019. Just under half (49%) intend to retain current levels of investment, while only 18% plan to increase TV spend.


    Addressable TV will bring new challenges to the planning process

    Smart and connected TV penetration reached 35.2% worldwide in 2018, paving the way for forays into addressable TV.

    Whilst still in its infancy, addressable TV technology gives advertisers the ability to leverage user data to combine TV’s reach with an expanded relationship to sales and lower-funnel KPIs.

    But research shows that US viewers are largely unwilling for their personal data to be collected to facilitate such advertisements. Other concerns include measuring addressable TV’s ROI accurately, and brands will need to weigh the benefits of its efficiency and frequency against increased media and creative costs.

    James McDonald, Data Editor, WARC, summing up, says: “TV is a stalwart of the advertising industry, used to deliver effective brand building campaigns with positive ROI to a mass, engaged audience.

    Addressable TV will be the next stage of evolution, though the $1bn spent worldwide this year is a fraction of total TV investment. As live TV still accounts for the majority of daily video consumption, the lure for advertisers is leveraging consumer data to get the right message in front of the right people at the right time.”


    Global media analysis: A round-up of TV
    :: 10.0% addressable share of TV ad impacts by 2022
    :: 41.9% TV’s share of global display advertising spend
    :: 56.4% live TV’s share of total daily video viewing in the UK
    :: 61.5% US consumers unwilling to have their personal data collected for more relevant TV advertising
    :: 62.0% TV’s allocation in successful high-budget (10m+) campaigns
    :: 71.0% proportion of long-term advertising-generated profit by TV