Category: RESEARCH

  • Gung-ho TV Advertising Trends


    By Indrani Sen


    Indrani Sen

    The recent TAM Axis report on TV advertising trends in India in 2018 published in ET Brand Equity (https://brandequity.economictimes.indiatimes.com/slide-shows/tv-advertising-at-a-glance-tam-report/68096082) on February 22, 2019 shows that contrary to the popular belief TV advertising revenue did not suffer in 2017 after introduction of GST. Demonetisation in 2016 was a big blow which crippled the growth rate, but the advertising revenue was back on its growth track in 2017 which accelerated in 2018.

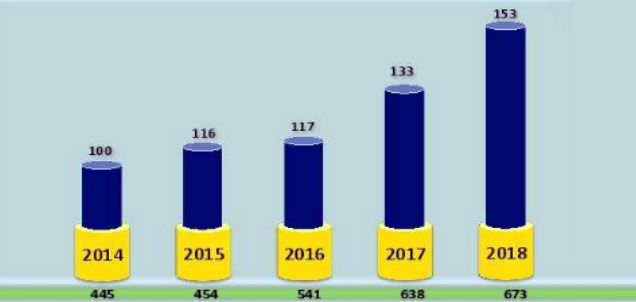
    Indexed growth rate of TV ad revenue 2014-2018: Source TAM Axis (AdEx India)

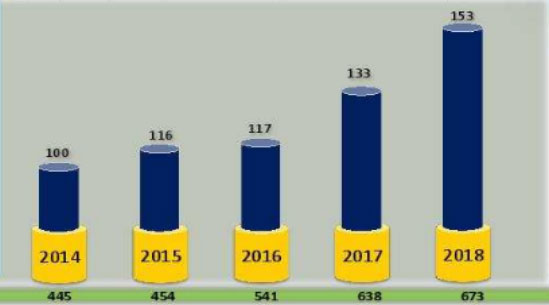
    N.B. The number of channels covered by AdEx is shown under each year in the green line.

    The above table shows that from 2014 to 2015 the index rose by 16 points and after adding only 1 point in 2016, it jumped by another 16 points in 2017 followed by 20 points in 2018. Over the last five years, from 2014 to 2018 there has been an overall growth of 53% in TV advertising revenue.

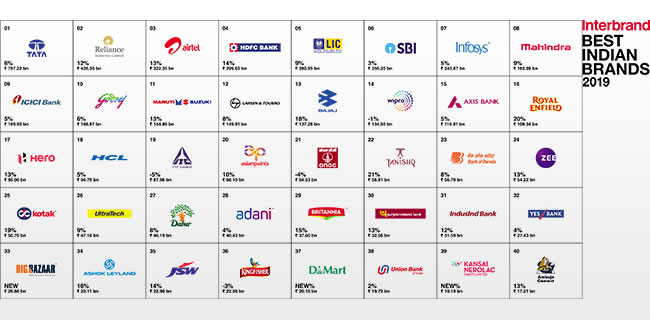
    Top 10 sectors in TV advertising in 2018: Source TAM Axis (AdEx India)

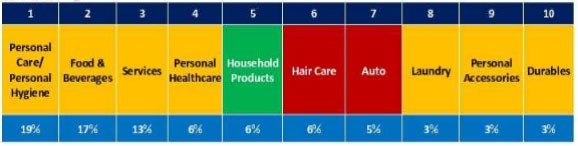
    The Top 10 sectors and the Top 5 sectors respectively account for 81% and 61% of total TV advertising revenue in 2018. While the Top 2 sectors retained their positions, household products rose from rank 7 to rank 5 with 43% growth in TV advertising in 2018 over 2017. Hair Care and Auto ranked lower in 2018 as compared to 2017 while Laundry, Personal Accessories and Durables held on to their ranks.

    It is interesting to note that of the Top 10 categories, 3 (Toilet Soap, Tooth Paste & Perfume /Deodorant) belong to Personal Care/ Personal Hygiene sector; 2 (Washing Powder/ Liquids & Toilet/ Floor Cleaner) belong to Household Product sector; 2 (Milk Beverages & Chocolates) belong to Food & Beverage sector; 2 (Two Wheeler and Cars/ Jeeps) belong to Auto sector and 1 (Shampoo) belongs to Hair Care sector. Though Services and Personal Healthcare hold the 3rd and 4th ranks among the top 10 sectors, no category from the two sectors feature in the list of top 10 categories which collectively account for more than 25% of the total TV advertising revenue.

    Top Ten advertisers accounted for 30% while top 50 advertisers accounted for 56% of the total TV advertising revenue in 2918. Hindustan Unilever topped the list with 10% share, followed by Reckitt Benckiser (India) and ITC who rose from 8th rank in 2017 to 3rd rank in 2018. Wipro and Amazon Online were new entrants among top 10 advertisers in 2018.

    The 2017-18 Annual Report of the Telecom Regulatory Authority of India (TRAI), published last week, indicates that the subscription revenues accounted for 59.5% of the overall TV industry revenue as it rose from Rs 38,7007 crore in 2016-17 to Rs 39,3007 crore in 2017-18. The report quoted the FICCI-EY Report 2018 which indicated that TV advertising revenues rose from Rs 20,1007 crore in 2016-17 to Rs 26,7007 crore in 2017-18, at a much higher rate of 32.8 per cent than reflected in the analysis of TAM Adex data for 2018, albeit referring to a different time period.

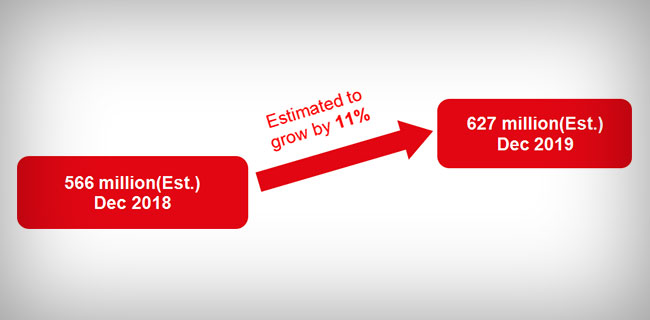
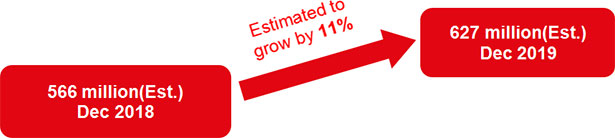
    Regardless of different reports based on different time periods, it is a reality that with close to 200 million TV households and 836 million TV viewers In India (Source: BARC Establishment Survey 2018), the Indian advertisers will continue to invest in TV medium for reaching out to the masses. The detailed analysis of TV AdEx data of 2018 by TAM Axis seems to indicate that Indian TV advertising revenue is all set for a roller coaster ride in 2019.

  • RAM Ratings for Week 5 & 6 – Jan 27-Feb 2 & Feb 3-9, 2019

    Here are the Radio Audience Measurement (RAM) Ratings for Weeks 5 and 6 of 2019… that’s January 27 to Feb 2, 2019 and Feb 3 to 9, 2019. Sourced directly from RAM. It may be noted that this is topline data which may be insufficient for taking business decisions on booking (or not booking) ads on radio stations. We urge advertisers to buy the research findings or ask radio stations and/or media agencies for detailed numbers


    Weekly RAM Report Wk 05’19


    Weekly RAM Report Wk 06’19

  • Internet usage in India > half a billion people: Kantar IMRB


    By A Correspondent


    Kantar IMRB has released its ICube 2018 report on digital adoption and usage trends in India. The annual tracking study, considered as the currency for digital adoption in the country, gauges the changing digital ecosystem in India, measuring Internet usage by demographic, activity and device segments.


    Said Preeti Reddy, CEO, Kantar South Asia:  “The Internet is transforming the way consumers and marketers interact with each other in today’s digital world. Kantar IMRB’s ICube; which has tracked the digital evolution in India for last 20 years, provides key measurement metrics necessary for planning any digital marketing or communication initiative. ICube continues to provide government, policy makers, digital businesses, marketers and communication specialists the intelligence necessary to stay on top of the developments across different facets of digital platforms and services.”


    Key findings include:

    :: The number of Internet users in India has registered an annual growth of 18% and is estimated at 566 million as of December 2018 – 40% of overall internet penetration.

    :: The report also projects double digit growth for 2019 and estimates that the number of internet users will reach 627 million by the end of this year.


    :: Of the total user base, 88 percent, or 493 million Indians, are defined as regular users, having accessed internet in last 30 days. 293 million active internet users reside in urban India, while there are 200 million active users in rural India.

    :: Unsurprisingly, the 97% of users use mobile phone as one of the devices to access Internet


    Rural India’s Digital Frenzy

    While internet users grew by 7% in urban India, reaching 315 million users in 2018, digital adoption is now being propelled by rural India – registering a 35% growth in internet users over the past year. It is now estimated that there are 251 million internet users in rural India, and this is expected to reach 290 million by the end of 2019.

    Increased availability of bandwidth, cheap data plans and increased awareness driven by government programmes seem to have rapidly bridged the digital gap between urban and rural India. Consequently, the penetration in Rural India has increased from 9% in 2015 to 25% in 2018

    :: Bihar shows the highest growth in new Internet user addition

    With one of the highest growth rates in the state GDP, it is no wonder that Bihar registered the highest growth in Internet users across both urban and rural areas; registering a growth of 35% over last year. This is closely followed by Orissa.


    Internet is now more gender balanced than ever before

    The gender digital divide is now closing. Kantar ICUBE 2018 reports that women today comprise 42% of total Internet users. Besides their sheer presence in the digital universe, women are also equally engaged and active in the digital world – spending as much time on the Internet as men.


    Added Hemant Mehta, Managing Director, Media and Digital, Kantar IMRB: “The latest edition of Kantar IMRB ICubeTM report shows that today the digital base in India is growing by over 75 million users each year – as much as the entire population of Germany! It is fascinating to note that the digital revolution is now sweeping small towns and villages perhaps driven by increased accessibility at affordable data costs. What is also particularly interesting, is the increase in the usage of digital in Rural India, where more than two-thirds of active internet users are now accessing the internet daily to meet their entertainment and communication needs. Marketers have a big opportunity today where they can use digital to reach their consumers – both in urban and rural India.”


  • RAM Ratings for Week 4 – Jan 20-26, 2019

    We are back to carrying of RAM numbers every week. Here are the Radio Audience Measurement (RAM) Ratings for Week 4 of 2019… that’s January 20 to 26, 2019. Sourced directly from RAM. It may be noted that this is topline data which may be insufficient for taking business decisions on booking (or not booking) ads on radio stations. We urge advertisers to buy the research findings or ask radio stations and/or media agencies for detailed numbers.


  • Tata stays as Interbrand #1


    Interbrand, the Omnicom-owned brand consultancy has named Tata, Reliance and Airtel as the three most valuable Indian brands of 2019. In its sixth year, the Best Indian Brands ranking saw retail make its presence felt in the league table, which was otherwise dominated by Automotive, Diversified Businesses & Financial Services sectors. Interbrand, it may be noted, only looks at the homegrown Indian brands, so the MNC brands are missing, even though they are popular, bestselling and trusted.


    The Auto sector shifts gears to drive top growth. Mirroring the brave global brands more than any other sector, the auto brands showed the way to the rest this year. Royal Enfield, Bajaj Auto, Ashok Leyland, Hero, Maruti Suzuki and Mahindra demonstrate growth higher than average.


    This year’s table features three new entrants. Big Bazaar joins at #33 (INR 26.86 Bn), DMart at #37 (INR 20.15 Bn) and Nerolac Paints enters the table at #39 (INR 19.19 Bn) for the first time. On the other hand, Reliance Group (R-ADAG; last on in 2017, INR 46.56 Bn) and Canara Bank (last on in 2017, INR 19.73 Bn) exited the list this year.


    The combined value of the Top 40 brands was INR 5.03 trillion, which represented a 5.2% growth in value over the previous year. Tanishq, Royal Enfield, Kotak, Bajaj Auto, Ashok Leyland and Britannia were amongst the fastest growing brands.


    Ever since its inception, Tata has continued to hold the top position in the Best Indian Brands table. However, Tata’s brand value grew by a modest 6.5% – contributed significantly by its tech services business TCS. In the same vein, Reliance, which after taking over the #2 spot from Airtel last year, consolidated itself as a strong #2 with a growth in brand value of 12%. This performance was bolstered by the phenomenal growth of JIO. HDFC Bank, LIC, State Bank of India, Infosys, Mahindra, ICICI Bank and Godrej round off the Top 10.


    Financial Services and Auto contributed the most to this year’s Top 40, at 27% and 13% of value.


    Said Ashish Mishra, Managing Director, Interbrand India: “Most Indian businesses looked at change as a big risk to their existence. But to them we would say: Risk is no longer in changing. But in not changing. And challenge is no longer just the competition or the ever-changing business environment. It’s our own inertia. Our fear of the new, of the unknown. And yet, most inevitably fight that change, trying to bend a fast-changing world to their obsolescence. What’s really encouraging is that we are now seeing the progressive few accept that the world is changing and making attempts to change. They acknowledge the new consumer preferences. They accept the new desire for experiences and respond positively. Replacing complacency with competitiveness. To reinvent themselves before they reinvent their categories. And remain unafraid of the change to drive brave growth. That, in sum, is the secret behind this year’s Top 40’s success.”


    Providing a global perspective on the Best Indian Brands 2019, Rebecca Robins, Interbrand’s global Culture and Learning Officer, added: “In a fast-changing world, brands are the only assets that companies can fall back on, to navigate the challenges. Indeed, brands are the crucial interface between technology and consumers, that channel an organisation’s efforts to engender growth. Globally, the one category that has managed this well, to constantly evolve; to lead new ecosystems; to craft highly personalised and meaningful micro-experiences while still being rooted in a larger purpose, is luxury. No wonder then, that the world’s and India’s top change drivers are taking a leaf out of the luxury playbook, to grow by adopting a “luxury mindset”


  • BBDO, Omnicom, Burger King & P&G top WARC ‘Best of the Best’

    By A Correspondent

    WARC has released the results of its first-ever ‘Best of the Best’ global index of excellence, to showcase the best all-round agencies and brands by aggregating results from across all three recently released WARC Rankings – Creative 100, Effective 100 and Media 100. No Indian agency or brand features in the Top 10.

    The WARC Rankings, successor to the Gunn Report and WARC 100, are annual rankings providing a global benchmark for campaign, agency, network, holding company, brand and advertisers’ success.

    The Best of the Best 2019 has been calculated by combining the 2018 results of the most prestigious and rigorous global and regional creative, effectiveness and media awards shows and competitions as determined by the industry following a worldwide survey and consultation.

    Said David Tiltman, Head of Content, WARC: “The culmination of the WARC Rankings is the newly launched ‘Best of the Best’. This identifies the best-performing companies across our three benchmarks of marketing excellence – creativity, effectiveness and media excellence.”

    BBDO New York and BBDO Worldwide are the best agency and network respectively across the WARC Rankings. BBDO New York performed strongly in both creativity and effectiveness, and its parent network, BBDO Worldwide, had a total of 59 offices contribute to its winning network total.

    Commenting on their success, Andrew Robertson, President and CEO, BBDO Worldwide, said: “‘The ‘Best of the Best.’ It literally can’t get better than that when it comes to public recognition of BBDO Worldwide. I am proud of, and grateful to, our clients and all of the people in our agencies who made this happen. Having four agencies from four regions all ranked in the Top Ten, including BBDO New York at No.1, demonstrates the breadth of talent in the network.”

    Omnicom Group tops the Best of the Best holding company ranking. BBDO Worldwide’s strong performance was supported by top 10 ranks for DDB Worldwide, PHD Worldwide and TBWA Worldwide.

    “It’s a proud moment to see Omnicom and its agencies topping the ‘Best of the Best’ list as the #1 network, #1 and #2 agency, and #1 holding company,” said John Wren, Chairman and CEO of Omnicom Group. “Employees across the globe come to work every day ready to deliver world-class services for our clients, and that shines through as they’re recognized by WARC for their creativity, marketing effectiveness and media excellence. Congratulations to all our people who can take great pride in these accomplishments.”

    Burger King tops the Best of the Best brands, with placings in the top 50 in all three rankings, and in first place in the Creative 100. The retail brand had 23 award-winning campaigns across all three rankings.

    Procter & Gamble topped the advertiser ranking by less than a point, as the two leading FMCG players continue to produce highly successful work, particularly in effectiveness and media. However, neither had a brand in the top 10. Instead, both had multiple successful brands throughout the depth of the rankings.

    The top companies in WARC’s Best of the Best 2019 are:

    The world’s top 10 agencies across the WARC Rankings

    RankAgencyLocationPoints
    1BBDONew York, USA489.8
    2adam&eveDDBLondon, UK466.7
    3McCannNew York, USA413.1
    4AMV BBDOLondon, UK410.8
    5MediaComLondon, UK390.8
    6Colenso BBDOAuckland, New Zealand351.8
    7LOLA MullenLoweMadrid, Spain343.1
    8McCannLondon, UK316.6
    9Host/HavasSydney, Australia288.3
    10AlmapBBDOSão Paulo, Brazil281.0

    The world’s top 10 agency networks across the WARC Rankings

    RankNetworkPoints
    1BBDO Worldwide3207.1
    2McCann Worldgroup2912.0
    3Ogilvy2006.7
    4DDB Worldwide1746.7
    5MediaCom1511.2
    6IPG Mediabrands1430.9
    7PHD Worldwide1395.2
    8TBWA Worldwide1315.0
    9Dentsu Aegis Network1298.2
    10Mindshare Worldwide1174.2

    The world’s top 10 agency holding companies across the WARC Rankings

    RankNetworkPoints
    1Omnicom Group8926.6
    2WPP8556.4
    3Interpublic Group5772.1
    4Publicis Groupe2714.6
    5Dentsu1398.5
    6Havas Group1151.5
    7Accenture260.3
    8Hakuhodo DY Group259.3
    9MDC Partners189.8
    10BlueFocus152.7

    The world’s top 10 brands across the WARC Rankings

    RankNetworkPoints
    1Burger King593.2
    2McDonald’s465.0
    3IKEA339.0
    4Coca-Cola327.9
    5Pedigree321.0
    6KFC299.6
    7Greenpeace260.4
    8Skittles260.3
    9Palau Legacy Project258.0
    10Nike257.8

    The world’s top 10 advertisers across the WARC Rankings

    RankNetworkPoints
    1Procter & Gamble969.8
    2Unilever969.1
    3Mars963.3
    4Restaurant Brands International593.2
    5Anheuser-Busch InBev567.6
    6Volkswagen Group553.8
    7McDonald’s573.5
    8The Coca-Cola Company469.5
    9Heineken382.3
    10PepsiCo347.3

    The Best of the Best ranking aggregates points across the three rankings. To ensure performance in each ranking has equal weight in the Best of the Best tables, a weighting for the effectiveness and media rankings has been calculated that inflates their scores versus the creative rankings. For this reason, points in the Best of the Best are not simply the total of the three individual rankings.

    An annual survey will be held to ensure that the WARC Rankings remain independent and the competitions tracked reflect the opinion of the industry.