Category: RESEARCH

  • 17 Things to Watch Out for in IRS 2017


    By A Correspondent


    With just a few hours in balance for the unveiling of IRS2017, there are many things one is looking forward at the late afternoon release of the report.


    Of course what will happen at the venue is just the release of the top-level data. What’s needed eventually is the detailed data which media owners, media agency professionals and advertisers will use for an analysis of what lies ahead for them and the business.


    We’ve made this list of 17 notable things that we would be looking forward to following post the release of the data.


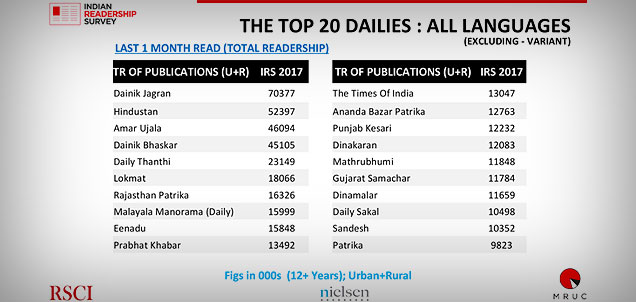
    1. Overall growth or degrowth of print

    Our sources tell us that print has grown in early double-digit percentage on the back of language publications. However, given that internationally print is declining and we’ve also seen India has consistently bucked the trend, it would be good to see how print news has done given the explosion of television news and also the rise of news served digitally – even in Hindi and regional languages.


    2. Will English get beaten given digital?

    And even if the overall pie grows, the focus will be on the English print news segment – specifically newspapers. If it degrows, and this could be a result of the rise of digital news in English, it could also offer indicators to the over print newspaper space.


    3. Magazines – further decline or growth?

    It’s possibly just a coincidence that a conference of magazine publishers was held earlier this week, just a few days before the release of IRS 2017. But, then, magazine publishers have over the years questioned the efficacy of IRS as a currency for buying print magazine space. But still it would be interesting to see the data for the mass readership-based print giants.


    4. Delhi ka Sultan Kaun?

    We’ve read about the battles for Delhi in our history books. But that’s been assorted leaders of another era. Over the last two decades, The Times of India has been steadily gaining ground in the capital and its surround areas. The top brass in TOI – wherever they may be in the world – will eagerly look at the numbers. As will the captains at Hindustan Times which has revved up its over the last decade-and-a-half. The question uppermost in everyone’s mind: who will forge ahead in Delhi and NCR in IRS2017.


    5. Pink City ki Rani

    It’s a market that’s not as large as many others, but given the presence of players DainikBhaskar and Rajasthan Patrika, the battle is as fierce as one of those several fought by the Rajputs and the Rajas many decades back. Whoever wins will raise the warcry from the rooftops, and whoever doesn’t, well, even the sky won’t be the limit for it to cry murder. Well, whatever


    6. Mumbai: The Battle for #2, 3, 4

    Mumbai is a clear market for English papers. The Times of India rules. Given that it comes as a part of an optional package, it’s smooth sailing for Mumbai Mirror. The battle now is for the next in line: Hindustan Times, Mid-Day or DNA. We think we know who will be the winner, but let’s wait for the data


    7. Will it be Sakal or challenger Lokmat in Pune?

    For around the last two years, numerouno Marathi paper Lokmat has been claiming the #1 status in Pune, a market that has been dominated by Sakal for decades. In the absence of an IRS, some of the claims stuck though they were fiercely contested by Sakal. IRS 2017 will bring in some clarity on this. As they say, doodhkadoodh, panikapani.


    8-11. Other Metros –The Leaders and the Challengers

    There is a challenger brand in all the other key metros, and while the leader has been known, it will be interesting to see what the data throws up. We’re referring specifically to Kolkata to see if there’s any impact on Telegraph and ABP at all. Similarly in Chennai, where The Hindu rules, but it will be interesting to see if The Times of India has been able to effect a dent in numbers. We would love to see the very well-designed New Indian Express also up there, but this is a battle for readership numbers, alas. Over the years, it’s The Times of India that has led Bengaluru given its changing demographics, but Deccan Herald is a local favourite too. Similarly, in Hyderabad, it would be good to see how Deccan Chronicle is doing vis-à-vis TOI.


    12. Tier 3 markets

    The need for data is huge in Tier 3 and Tier 4 markets too, including the non-English space amongst regional leaders. Of particular interest are: Nagpur, Raipur (and rest of Chhatisgarh), Bhubaneswar, Kochi (and rest of Kerala)… the list could go on.


    13-14. Lucky for whom – MP, UP… rest of cow belt

    The battlelines are huge, and possibly should have been ranked higher. It will be interesting to see how the old favourites will do here. Of particular interest to us is how the UP leaders do – DainikJagran, Amar Ujala and Hindustan. Madhya Pradesh has DainikBhaskar dominating, but Patrika is around and is not known to sit pretty


    15-16-17.  Perhaps this should have been the first point. Or perhaps it should have been all the points. But a lot depends on how the MRUC and RSCI respond to cribs of its constituents. The last time around, we believe there was a breakdown because of some cowboys on both sides of the divide. This time around, we hear much pragmatism has prevailed. Hurray for that!


  • IRS 2017 Live! Today, Jan 18, 3pm onwards

    The live webcast of the IRS 2017 was aired from 3 to 5pm today.

    We’ll post a link to the video recording in a few days.


  • Rejoice! IRS2017 is out!


    By A Correspondent


    There has been much sense of anticipation about IRS2017 since a few months when the finishing touches and validations were being conducted. And when the toplines were unveiled finally in the presence of around 250+ media professionals and over 10,000 others over a live webcast facilitated by MxMIndia and 24FramesDigital, there was a deep sense of relief.


    There were some who were dismay as they didn’t do very well in the basic data that was revealed, there were some others who were wondering why the MRUC and RSCI weren’t rolling out the bubbly.


    So first let’s read the official press release that we were given post the unveiling:

    The Readership Studies Council of India (RSCI) and Media Research Users Council (MRUC) are pleased to announce that the Indian Readership Survey (IRS) 2017 Report has now been released.


    For the record, the IRS 2017 Report covered a full year sample of 320,000 households – the highest ever in the history of any readership study in the world. The large sample size was backed by a meticulously designed methodology, which saw the use of 100% Dual Screen CAPI followed by a tighter scrutiny process via continuous backchecks, accompaniments, use of audio recordings, and third-party field audits. These enhanced levels of Quality Control deployed by the IRS TechCom has ensured veracity of data capture for all quarters. The robustness of capture of media consumption across all media has been significantly enhanced due to the increased sample size and better representation across all pop strata.


    All key stakeholders had been actively engaged by RSCI and MRUC all through the fieldwork period to keep them updated and aligned on the progress.


    Some exciting new features have been included in this round of the IRS.


    Reach analysis across all media types has now been brought to a common platform with the introduction of 1-month penetration numbers for all media types. This will now enable an apples to apples comparison across media types.


    The IRS 2017 Report also offers new readership metrics. Apart from the standard and well-established Average Issue Readership metric, one can now look at data from the perspective of Total Readership (TR), and Readership of publications by time frames of Last 7 days and Last 3 days.  These new metrics have been introduced to provide a true representation of the changing consumption habits among Newspaper readers.


    Another interesting development has been the capture and reporting of readership for the Main issue of Newspapers versus their Variants. Each of them are now reported separately in IRS 2017.


    Commenting on the release of IRS 2017 Report, Ashish Bhasin, Chairman, MRUC and Chairman and CEO – South Asia, Dentsu Aegis Networks, said: “According to the findings of the Report, 39% of Indians (12+ years) read newspapers, and 20% of all newspaper readers in 50 Lakh plus population towns read newspapers online. These numbers most definitely tell us that there is a bright future waiting for the Print industry. I’m also hoping that we will now begin to see advertisers and media agencies taking Print more seriously. Increased readership numbers for newspapers and magazines will pave the way for publishers to increase their revenues, which would in turn help increase the size of Print as a medium.”


    Bhasin further said: “The support we have received from across constituencies for bringing out this Report was phenomenal and it was very pleasing to see the key stakeholders contributing in many ways to improve the study that has been in existence since more than two decades.”


    Noted Shashi Sinha, RSCI Managing Committee Chairman, and CEO, IPG Mediabrands: “I’m delighted to share that the findings of the IRS 2017 Report mirrors the market reality in terms of media reach and the performance of individual media channels be it newspapers, magazines and broadcasters.  The methodology deployed to capture data quarter-on-quarter was the very best for a study of this scale and kind, and the sheer focus on Quality Control makes this Report a reliable one and a real stand out.”


    Said NP Sathyamurthy, Chairman – RSCI Technical Committee and Executive Director, DDB Mudra Group: “The IRS 2017 Report is the outcome of great minds from different streams working together toward a common and shared goal to come out with a research that sets the highest standards globally. Absence of readership data for four years meant that we had to work that much harder and smarter to bring the study back in action and in line with the market truths and expectations.”


    Sathyamurthy further noted: “From 2016, when we began the fieldwork, up till last month when we completed the validations for all four quarters, the journey wasn’t easy, and had its own special twists and turns. Furthermore, we have strengthened the Report with additions such as TR, readership numbers for 7 days and 3 days and the separate reporting of newspaper variants. IRS 2017 marks a new innings for this trusted Industry study.”


    There were murmurs against the return of Total Readership (TR) as a currency. At least two publishers and a former member of the thinktank rubbished the decision of using TR and alleged that it has been done at the behest of some powerful newspapers who want to project a healthy picture for the industry. When a senior functionary associated with IRS2017, he/she retorted that it was the Board’s decision to use TR, and not the whim of an individual.


    Another senior media agency professional told MxMIndia, that there is a crying need for an apples-to-apples comparison being thrown by audience measurement studies.The professional told us about how in the case of television audience measurement too, the metric deployed in public is impressions. Similarly, he/she told us that there is merit in a metric that will help planners make more informed decisions will help the agency fraternity considerably. Meanwhile, an advertiser who MxMIndia spoke with, underscored the need for a realisation that there is need for a good, solid currency for all media. “It’s time media owners realise that we will only put money, when we can be sure of performance… We are not in the business of charity.”


    Indeed.


    Meanwhile, the data is set to roll from the second half of today. However, it will be downloadable only if users agree to a Code of Conduct/Usage. What this Code contains, the heads of RSCI and MRUC didn’t tell us at the launch on Wednesday, but there are indicators that the Code could make it difficult for publishers to fool around much with the way they slice and showcase data.


    IRS 2017 Launch toplines

  • Just in case you missed it: The IRS Webcast brought to you by MxMIndia & 24FramesDigital

    The IRS2017 release last week was truly historic. In more ways than one. For one, it was the largest ever audience measurement study globally. Two, it was being released after a long gap. And, three, for the first time ever, it was webcast live.

    Just the webcast alone saw 8,911 page views, which given the size of the industry, is significant. While the real thing is before us (all those who’ve subscribed to the data that is), here’s a link to the webcast which will be on this page till around February 14.

    View on!


  • Global adspend to accelerate in 2018: WARC


    By A Correspondent


    WARC, the international marketing intelligence service, has released its latest monthly Global Ad Trends report digesting up-to-date insights and evidenced thinking from the worldwide advertising industry.


    Focusing on advertising expenditure in 96 markets, this latest Global Ad Trends report includes key trends in spending patterns by media and geography since 2009, a round-up of 2017, as well as full-year projections for 2018.


    Global growth is forecast at 4.7 per cent to a total of US$572bn this year, boosted by the Pyeong Chang Winter Olympics, FIFA World Cup, US mid-term elections and reduced dollar volatility in emerging markets.


    Growth in North America (+5.0 per cent), Asia-Pacific (+6.0 per cent) and Western Europe (+2.6 per cent) is expected to hasten in 2018, while Central and Eastern Europe (+8.4 per cent) and Latin America (+7.0 per cent) will continue to expand at a strong rate. Advertising spend across the Middle East and Africa is expected to dip once more (-4.1 per cent), though at a lesser rate than in previous years.


    Global advertising spend rose 3.0 per cent to US$546bn in 2017, according to new projections based on data for 96 markets. The growth rate in 2017 represents a slowdown from the 3.8 per cent rise recorded in 2016, partially owing to weaker growth in the United States (which accounts for 34 per cent of the value of advertising worldwide).


    The slowdown in the US contributed to an easing in growth across North America as a whole. Adspend in the region rose 3.3 per cent to US$199.6bn in 2017. Growth in the world’s second-largest ad region, Asia-Pacific, also cooled (+4.3 per cent to US$162.8bn in 2017, as growth in Japan (23 per cent of the regional total) was muted by a weaker Yen. The Chinese ad market – which accounts for 41 per cent of Asian and 12 per cent of global advertising spend – expanded by 4.7 per cent to US$66.7bn last year, propelled by rapidly increasing spend on mobile ads.


    Mobile increased its share of global advertising expenditure by an estimated 5.9 percentage points (pp) to 20.6 per cent in 2017, equivalent to US$112bn (up 44.5 per cent year-on-year). Approximately 45 per cent of mobile advertising spend is based in the US, where US$156 dollars per capita is spent on mobile ads.


    Mobile is thought to have been the only media channel to have gained share year-on-year. Estimates indicate that mobile overtook desktop internet for the first time in 2017, as spend on desktop ads was thought to have taken a share of 18.3 per cent (down 1.9pp year-on-year).


    The largest media channel, TV, is estimated to have registered a 1.4pp dip in 2017, taking a share of 36.5 per cent of the global adspend total (US$199.5bn). Print continues to lose share, the channel was down an estimated 2.2pp in 2017 to 12.5 per cent. Since 2009, print has recorded a massive 21.5pp decrease in its share of global adspend, and has lost an average US$11.5bn each year since 2012.


    Out of home’s share dipped by 0.1pp to 5.7 per cent in 2017, while cinema’s share held at 0.7 per cent and radio was down by an estimated 0.2pp to 5.7 per cent.


    James McDonald, Data Editor, WARC, says: “2018 should be a stellar year for global advertising, with ad investment set to grow at its strongest rate since the post recovery years of 2010 and 2011. All global regions, with the exception of the Middle East, are expected to register growth, supported by key quadrennial events – notably the Winter Olympics in South Korea, the FIFA World Cup in Russia and the US mid-term elections.”


    He added, “Mobile is now a key driver of global growth, and was the only channel to gain share of spend in 2017 – it now accounts for one in five ad dollars worldwide. Nevertheless, traditional media still attract 61% of global ad investment, and TV and out of home will be among the main benefactors of increased brand and political campaign spending this year.”

  • 160-plus and booming


    By A Correspondent


    The last decade-odd has seen the booming of news channels in India, and with the next general elections as also elections in key states not very far away, the focus on the news channels genre is set to grow. Given this, a BARC report titled ‘Breaking the News Story’ assumes importance as it dissects some interesting facets of the business.


    While we recommend a close look at the full report (link: http://www.barcindia.co.in/resources/Breaking %20the%20News%20Story.pdf), here’s a summary of the report that we have culled from the pdf:

    [] News is the third largest genre on television in terms of viewership, with 160+ channels across English, Hindi and Regional languages.

    [] The News genre has witnessed an overall growth of 15% in the number of channels from previous year. English News channels have witnessed the maximum increase compared to Hindi and Regional News channels.

    [] As compared to Total TV viewership, News Genre audience is skewed towards Males, age group of 22+ years and NCCS A & B.

    [] News is a dynamic and event driven genre. Politically significant, scheduled events, such as State election results have consistently led to spikes in news viewership.

    [] Some unforeseen events also lead to massive spikes in news viewership, due to high intensity and impact. For example- Demonetization, demise of Jayalalitha, Surgical Strike Operation.

    [] The immediate effect of a big news story can be gauged by the corresponding rise in viewership. But, while more number of people tune in, the viewing trend by daypart remains similar to the general trend. i.e. Viewership peaks once in the morning and once in the night. A slight increase is also observed in the afternoon.

    [] It appears that in the case of unscheduled events, viewers prefer quick takeaways and therefore consume short formats such as news bulletins, but in case of scheduled news events, viewers may also be interested in more detailed formats viz. Interviews/ studio discussions etc.

    [] The breaking of a big news story impacts the genre composition on Television, as viewers start moving to news channels for updates. In case of demonetization, News genre gained 10% share of eyeballs and became the second most viewed genre on the day following the announcement.

    [] News events also have varied impact on advertising. In some markets, the programming share on news channels increased on election result day, to keep viewers hooked. However, in one market, an increase in break duration was also observed. This may be a strategy of increasing ad inventory for advertisers to reach the high number of audiences that tune in.

    [] In case of an economic event such as demonetization, Total ad FCT on news channels went down by 13%. However, some categories such as ATM, Anywhere Banking Services, and Online Shopping benefitted from the situation and increased their ad insertions to promote their services.


  • Voice & what it means for Marketers


    Republished from Zenith’s ‘Global Intelligence 2018 – The Year Ahead’ report


    Predictions for 2017

    Voice is the next big step in computing, after the transition from desktop to smartphone. Developments in machine learning and natural-language processing have driven the rapid growth of voice search and smart speakers, promising dramatic changes in the way we search, shop and interact with companies. The interface is simple and delivers a single, best answer, instead of the slew of search results we are accustomed to onscreen. These devices also play music, set timers, control other devices about the home, and place shopping orders.


    What happened in 2017?

    Thanks to a sharp fall in prices, smart speakers have become true mass-market devices, with 33.2 million shipped over the past 12 months according to Canalys. Smart speakers are becoming the central control hubs for the smart home. Using them quickly becomes a habit – they are not a short-lived fad.

    Voice shopping is picking up quickly. Amazon’s Alexa adds items to a shopping basket and completes the purchase using just voice commands, and even offered exclusive deals on Black Friday. Still, brands have had trouble redefining themselves for this new reality, after spending years perfecting the arts of designing, packaging and marketing their products visually.


    What’s next?

    According to Gartner, voice search will be the fastest growing mobile search channel in 2018, and com Score predicts 50% of all searches will be made by voice in 2020. Google’s aim is to improve its ‘Answer Box’ to provide the most accurate and best content. The same principle works for Google Home and Alexa, which are focusing on the best products and services to ensure good experiences for consumers. We’ll see intelligent services learn not just to talk to us but to learn to recognise emotion, engage and have meaningful conversations.


    The big tech companies – Google, Amazon, Microsoft and Apple – are fighting to deepen consumer engagement by embedding their assistant platforms across all consumer electronics. Other companies recognise the need to improve time to market through collaboration, partnerships and open platforms. For example, numerous car manufacturers are integrating voice assistants into their 2018 and 2019 models, and Samsung is bringing its voice assistant Bixby to its smart TV sets and Family Hub fridges.


    By the end of 2018, voice will have changed the way devices and applications are designed, and will be on the way to becoming the primary interface by which we engage with technology and the world around us


    What does this mean for marketers?

    As consumers become accustomed to digital assistants, they will start to expect more from them. They’ll seek out virtual personalities that have the power to entertain, educate, befriend and heal. For smart brands, it’s time to start thinking beyond virtual assistance – and about true virtual companionship.


    In the immediate future, device manufacturers are banking on voice-enabled devices to usher in a new era of smart homes controlled by the gadgets they sell. The winning virtual assistant will be the one that first achieves ubiquity. It’s about doing everything, and being everywhere.


    Big leaps in voice interaction require large volumes of data for machine learning to crunch. Marketers will need to have a comprehensive data strategy in place to improve the value of their services.


    As shopping powered by voice technology gains traction, marketers will rethink their business models. Modern voice systems are built around conversations, through intelligent multi-stage conversational interfaces, so brands will have to make shopping for their products and services an intuitive experience. Brands should also look out for new opportunities as the likes of Amazon and Google seek to monetise their smart speakers, by ads or other commercial partnerships.


    Republished from Zenith’s ‘Global Intelligence 2018 – The Year Ahead’ report


  • Adspends to grow 12% in 2018: Madison


    By A Correspondent


    The agency that pushed the ‘Achche Din’ campaign for the BJP in 2014 indicated that it may well be the good times this year. For, what we had in 2017 was indeed ‘burre din’. The AdEx grew just 7.4 per cent last year. Compare the growth number in 2016… it was 12.5% and in 2010 it was 27.8%. Of course in 2012, it was just 5.2%.


    That’s enough to get a better view of the findings of the Pitch Madison Advertising Report 2018 that was released by D Shivakumar, President, Aditya Birla Group on Thursday. MxMIndia was invited to the event.


    Key findings of the report:

    A. Overall:

    1. Growth in the Indian Advertising Market slowed down to 4% in 2017, thanks to the after-effects of demonisation and GST roll-out. Traditional Media during 2017 grew by only 4%, the lowest in half a decade while Digital Media grew by 27.2%, taking the overall growth to 7.4%. In absolute terms, the Indian Ad market grew by Rs3,658 crores to take the industry to Rs 53,138 crores in 2017.

    2. AdEx was slow to recover from the impact of demonetization and first quarter of 2017 saw a de-growth of 2% and a growth of mere 2% in second quarter. Just when we expected AdEx to gather steam, GST was announced in July and the market saw a drop of close to 20% in traditional media over June 2017 and a drop of 5% as compared to July 2016. Mercifully, the  festive period brought cheer to AdEx and it grew from August to December by 13%. But because of the slow start in the first half and a drop in July the whole year’s AdEx is estimated at Rs. 53,138 crores, a growth of mere 7.4%.

    3. With a growth rate of 7.4% the Indian market has lost its stellar position of being the fastest growing advertising market in the world and has conceded that position to Russia, going by WARC estimates of international markets.

    4. Television continues to be largest contributor to AdEx with 37% share, but grew by just 4.3%, closely followed by Print at 35% share but with even a lower growth of just 2.7%.

    5. Digital that grew by 27.2% now contributes to a whopping 18% of Indian AdEx. Digital gained 3% share points at the expense of Television and Print who lost 1% and 2% share points respectively.

    6. Radio, Cinema and Outdoor have all grown at a much faster pace than Television and Print and maintained their share in 2017. But share of Digital continues to be more than combined share of Radio + OOH + Cinema and we don’t expect this trend to change in near future.

    7. The categories that have contributed to growth in Print, Television and Radio (and accounted for 56% of growth of Rs. 3,658 crores) have been FMCG followed by Telecom and Automobiles. FMCG continues to be the most dominant sector with a 32% share followed by Auto at 10% and Telecom at 8%. E-commerce that had taken the media market by storm three years ago contributed only 4% to AdEx (compared to 10% in 2015). With implementation of Real Estate Regulation and Development Act (RERA), Real Estate and Home Improvement category as a whole has registered a de-growth of -3%.


    B. Television:

    8. Television AdEx grew by a mere 4.3% and reached Rs. 19,650 crores. This is the lowest growth television has witnessed in the last 5 years. The growth is so low, despite the addition of 100 new channels including cable channels, which in turn contributed to an increase in FCT supply of 11% in 2017. Like-to-like channels shows an increased FCT supply of 7% leading one to conclude that on an average television rates were suppressed, but Advertisers could not reap the benefit of this because of lower ratings.

    9. HD emerged stronger during the year with the launch of 22 HD channels, now reaching 50 million homes split equally between Urban and Rural. Viewership of HD channels has also seen exponential growth and we estimate that HD is today Rs. 2,000 crore advertising market contributing over 10% to the television Adex.

    10. FMCG continues to rule the roost contributing 51% to the total Television spends followed by Telecom 12% and Auto 8%. It’s the same 3 categories that have mainly contributed to the growth of Rs. 820 crores in Television AdEx in 2017. E-Commerce maintained its contribution at 4%.

    11. Hindi GECs including FTA contribute 28% of overall television AdEx and Hindi is by far the largest contributor to television AdEx. FTAs channels have seen robust growth in viewership during the year and account for 19% of the Hindi GEC plus FTA genre.


    C. Print:

    12. Print grew by a mere 2.7% during the year. This is the lowest growth we have seen in 9 years. But it continues to be 2nd highest contributor after television with a share of 35%. It is significant to note that for the last 3 years, Print has been steadily losing share at a rate of 1% share point every year for last 3 years, but this year the decline accelerated and Print lost 2% share points. Dailies increased 3.4%, a bit higher than the total Print AdEx, because Magazines as a medium failed to gain advertiser interest for the 3rd year in succession.

    13. In terms of volume, Hindi publications continue to be ahead of English publications, contributing 34% of the total volume. English publications come close behind at 27%. Contrary to popular belief, volume in English publications has grown by 4% while volume in Hindi publications degrew by -4%. The degrowth in volume of Hindi publications has been observed for the first time in many years. Among other languages, Kannada and Gujarati publications have shown a substantial increase in volume, but Punjabi, Urdu and Tamil publications show a decline.


    D. Digital:

    14. Though there has been exponential growth in Video consumption over the past year, Display, Native and Programmatic have also picked up rather well with Mobile becoming the primary choice to consume content. Newer display advertising elements, Mobile, Online Video and Programmatic are all helping attract more advertising investment into Digital.


    E. Forecast:

    15. The forecast for 2018, is that Adex will grow by 12.03% taking the industry to Rs. 59,530 crores.Highest growth rate should be achieved by Digital (25%) followed by Cinema (14%), TV (13%), Radio & Outdoor (10% each) and Print (5%).


    Said Sam Balsara, Chairman, Madison World: “Demonetisation and GST have causedheadwinds resulting in a stunted AdEx. But you can’t keep advertising or for that matter the Indian economy down for too long. So we are cautiously optimistic about 2018 and project a growth rate of 12% for 2018 with digital again growing by 25%. To take advantage of the figures released by IRS which revealed dramatic growth in Total Readership, publishers will be well advised to offer incentives to advertisers for repeating the same ad in the same publication 2-3 times a month.”

    Pitch Madison Ad Outlook 2018 Published Report


  • Internet users set to cross 500mn by June 2018: IAMAI-IMRB


    By A Correspondent


    The number of internet users in India was estimated to be 481 million in December 2017, a growth of 11.34% over December 2016 estimated figures. The number of internet users is expected to reach 500 million by June 2018, according to a report ‘Internet in India 2017’, published jointly by the Internet and Mobile Association of India & Kantar IMRB, today. According to the report, as on December 2017, the overall internet penetration is 35% of total population.


    According to the findings of the report, Urban India witnessed a growth of 9.66% from December 2016 and is presently estimated to have around 295 million internet users as on December 2017. On the other hand, Rural India witnessed a growth of 14.11% from December 2016 and is presently estimated to have around 186 million Internet users as on December 2017.


    Even though the growth rate of Rural India may seem higher, it is mainly due to the low base effect; given overall internet users in Rural India are still critically low. Internet penetration in Urban India was 64.84% in December 2017 as compared to 60.6% last December. In comparison, Rural Internet penetration has grown from 18% last December to 20.26% in December 2017. Given that total Urban Population is much lower than total rural population, the Urban-Rural Digital divide is actually more acute than what the penetration numbers portray.


    The future growth policies therefore must focus on bridging the digital divide that exists between urban and rural India today. In terms of numbers, Urban India with an estimated population of 455 million already has 295 million using the internet. Rural India, with an estimated population of 918 million as per 2011 census, has only 186 million internet users. Thus, there are potential 732 million users still in rural India; if only they can be reached out properly.


    Frequency:

    The report also finds that an estimated 281 Million daily Internet users, out of which 182.9 million or 62% access internet daily in urban area, as compared to only 98 million users or 53%, in rural India. Almost double the proportion of Rural Users access internet less than once a month in rural India as compared to Urban India.


    Gender:

    Internet user market is still a male preserve in India. There are estimated 143 million Female internet users overall, which is approximately 30% of Total Internet users. While “Digital India” is paving its way in rural India, the underlining digital gender gap still persists. Digital literacy is therefore a key to ensure everyone stays informed, engaged and safe online.


    Among the Rural Internet users, the ratio between male to female Internet users is 64:36. The proportion of Internet users by gender in Rural India has seen much change over last year with Internet users among rural females growing steadily. The increasing gender parity in internet usage is a welcome development.


    Demographics:

    In terms of other parameters of demography, according to the report, internet is the preserve for youngsters, with Students and youngsters accounting for around 60% of all internet users in India. The demographic profile and the purpose of usage are interlinked. Popularity of entertainment, social networking etc makes internet more attractive for youngsters presently. Unless digitalisation of important civic and social services as envisioned under e-governance programmes really take-off, the internet will remain to be perceived as a medium of entertainment for youngsters.

    Internet in india_10-1-18.compressed


  • Mind the TV AdEx Gap!


    By Indrani Sen


    For two consecutive years, TYNY by GroupM and PMAO by Madison were released during the same week, giving the industry lot of food for thought and facts and figures to chew and digest. TYNY or ‘This Year Next Year’ closed the estimate for total AdEx 2017 at Rs 61,263 crore with a growth rate of 10% over 2016, while PMAO or ‘Pitch Madison Advertising Outlook’ showed a growth rate of 7.4% in 2017 over 2016 and estimated the total AdEx as Rs 53,138 crore.

    After a year of stagnation and stunted growth in 2017, mostly due to the after effect of Demonetisation and Goods & Services Tax (GST),both the reports predict a better year in 2018 with a growth of total AdEx by 13% and 12% respectively.

    According to both the reports, Digital is going to have the highest growth in AdEx in 2018, 30% according to TYNY and 25% according to PMAO. Both reports predict 13% growth in TV AdEx and 4% (TYNY) and 5% (PMAO)in Print AdEx. Both agree that the highest growth after Digital will be achieved by Cinema (20% TYNY & 14% PMAO) which has the smallest share of the advertising pie. Both have shown same percentile growth rates for OOH and Radio (15% TYNY & 10% PMAO).

    The chart below shows that PMAO’s estimates for growth for all media, except TV and Print, are more conservative than TYNY.


    In my analysis of the two reports last year (http://www.mxmindia.com/2017/02/what-is-the-real-size-of-indian-ad-industry/), I found a difference of around Rs 5000 crore between the two projections made by TYNY and PMAO for all media in 2017. The difference was mainly due to the disagreement between the projections for TVAdEx in the two reports with GroupM’s projection being almost Rs 6000 crorehigher than PMAO’s.

    In the projections for 2018, the gap in the all media AdEx between the two reports has widened to almost Rs10,000 crore with TYNY predicting the total industry size as Rs 69,347 crore and PMAO predicting it as Rs 59,530 crore. As seen last year, most of this difference is due to the Rs 9,391cr difference in the projections of TV AdEx shown in the two reports.


    Unless this widening gap in TV AdEx is reviewed by both the agencies and explained to the industry at large, it would become increasingly difficult for the A&M industry to assess the actual size of the TV AdEx. I think there must be a difference in the methodology followed by the two agencies for estimating TV AdEx which results in the different estimates.

    On behalf of the A&M fraternity, I appeal to both GroupM and Madison for a clarification so that we have a better perspective and understanding about growth of Indian advertising by media over the years.

    Indrani Sen is a veteran advertising professional and is now Adjunct Professor with the Symbiosis International University, Pune. The views here are her own


  • @FICCI-FRAMES18: ​How Ratings Reflect Real Viewership


    By A Correspondent


    Partho Dasgupta

    On Day 2 of FICCI-Frames 2018, BARC CEO Partho Dasgupta addressed delegates in the session titled ‘The Future of TV’. The speech was interesting as it drove home the point – based on data of course – that ratings is impacted considerably on viewership behaviour and patterns. The presentation below is self-explanatory, hence we haven’t transcribed his speech here.


  • Mindshare, MediaCom Mumbai in Gunn’s World Top 10 for media excellence


    Gunn Report, the global index of excellence in advertising, has released the results of the 2018 Gunn Media 100, a global ranking of the world’s most awarded and applauded campaigns and companies based on their performance in media competitions around the world.

    Gunn Report, now part of WARC, tracks the winners’ lists of close to 30 of the most important global, regional and national media awards shows to compile Gunn Media 100 – a list of the 100 best campaigns for creativity and innovation in media, along with the best-performing agencies, networks, holding companies, brands, advertisers and countries.

    The highest-ranked campaign in the Gunn Media 100 is McDonald’s ‘Capacity Based McDelivery’ by OMD Singapore. To maintain competitive advantages, McDonald’s promoted its delivery service McDelivery in Singapore in partnership with Google. By integrating McDonald’s first-party data with Google’s hyper-local targeting, they maximised media cost efficiency and managed consumer expectations of delivery time through tailored messages, mapping real-time restaurant data against paid search spends via a live API.

    Said Stephen Li, CEO of OMD APAC: “To have our work for McDonald’s recognised as best of the best globally, is testament to our unwavering commitment and relentless focus on helping our clients’ leading brands continue to cut-through with data-driven creativity. This recognition motivates us to continue our drive in helping brands make better decisions, faster. The ‘Capacity Based McDelivery’ campaign is the perfect example of this in practice, leveraging real-time data to generate fresh growth for a market-leading brand in a highly competitive category. I could not be more proud of this achievement, and all the other great work coming out of OMD Singapore. It only inspires us to continue raising the bar even further still for our clients.”

    In second place is ‘Hungerithm’ by MediaCom Melbourne / Clemenger BBDO, which saw confectionary brand Snickers partner with 7-Eleven stores in Australia to drive sales and increase category share. Snickers says the internet gets angry when it’s hungry. The brand launched ‘Hungerithm’, an algorithm that analysed 14,000 social posts a day and adjusted the price of the chocolate bar accordingly.The angrier the Internet got, the cheaper Snickers became.

    Ranked third is ‘Reword’ for Headspace by Leo Burnett Melbourne / Starcom Melbourne. The Australian youth mental health foundation, successfully tackled cyber bullying by putting in place a social media rewording tool that analyses what users type and uses a red line to strike through abusive phrases.

    Three themes have emerged from the world’s top campaigns for media excellence:

    :: Data is driving fresh media thinking. The top campaign is built around smart use of data. This is a recurring theme in the rankings, as brands look to harness multiple data sources to deliver competitive advantage.

    :: An event-led strategy helps brands stand out. As brands struggle to be heard in a fragmented media landscape, there is a growing focus on ‘events’ such as Super Bowl, US Presidential debates, and Olympics, that can draw a crowd and interest from the press.

    :: Partnerships are central to youth-focused media strategy. Partnerships with organisations or individuals that bring their own reach are now a key element of media strategy, particularly for brands targeting younger demographics.


    MediaCom London claims first place in the Gunn Media 100 agency rankings with four campaigns ranked in the top 100: ‘Best Day Of My Life’ for Shell (#6), ‘Singing Our Way To The Top Of The Box Office’ for Universal Pictures’ Sing (#22), ‘Missing Type’ for NHS Blood & Transplant (#30) and ‘Dark To Light’ for Gucci Guilty (#77=).

    PHD New York is in second place also with four campaigns in the top 100. Their highest ranked campaign (#13) is ‘The Debate Headache’ for GlaxoSmithKline’s Excedrin. Mindshare Mumbai is ranked third with three campaigns making the cut.

    MediaCom is the top-ranked network with eight agencies from around the world – Auckland, Bogota, Dusseldorf, London, Mumbai, Melbourne, Mexico City, New York – contributing to the network’s poll position. PHD Worldwide is in second place and OMD Worldwide, third.

    For the first time Gunn Media 100 has included a ranking of holding companies. WPP tops the leader board, with three of its networks – MediaCom, Mindshare Worldwide and Wavemaker – ranked in the top 10. Omnicom Group and Interpublic Group follow.

    Stephen Allan, Worldwide CEO and Chairman of MediaCom, said: “This is an outstanding achievement, of which I am extremely proud. Every single person throughout the MediaCom network has contributed to our success and has truly embraced our philosophy of Systems Thinking to great effect.

    “I am, of course, delighted that MediaCom UK has also been recognised within the Gunn Media 100 as the top individual agency, which is incredibly well deserved. But none of this would have been possible without our fantastic clients, agency partners and media owners who have collaborated with us to create globally-celebrated campaigns. We are proud to have contributed towards WPP’s achievement of being named the top Holding Company within the same report.”

    CEO of WPP, said: “WPP’s core purpose is to deliver growth for our clients so we are delighted to receive this recognition of our effectiveness in doing so. And congratulations to MediaCom who, as network and agency of the year, have helped us achieve a hat-trick of awards.”

    Nike takes first position as the top brand with four campaigns featured in the top 100, all from the US. McDonald’s is in second place, followed by Snickers and Dove.

    Unilever tops the Advertiser’s ranking by a significant margin. Procter & Gamble is in second place. Both advertisers have six brands featured in the top 100 campaigns. Mars takes third place with five campaigns in the top 100.

    The US dominates the rankings with 30 campaigns in the top 100, 12 of which feature in the top 20. UK is second with 11 campaigns. Australia and India follow. In total, 24 countries are represented.

    The most highly ranked campaigns and companies in Gunn Media 100 are:

    The world’s top 10 campaigns for media excellence

    Rank Campaign title Brand Agency Points
    1

    Capacity Based McDelivery

    McDonald’s OMD Singapore 136.1
    2 Hungerithm Snickers

    MediaCom Melbourne / Clemenger BBDO Melbourne

    131.2


    3 Reword Headspace  Leo Burnett Melbourne / Starcom Melbourne 129.1


    4 Bachelor Of Shaving Gillette MediaCom Mumbai 122.5
    5 Bradshaw Stain Tide Saatchi & Saatchi New York / Hearts & Science New York 106.1


    6 Best Day Of My Life Shell MediaCom London 105.4
    7= Sport Chek – The Fastest Olympic Campaign! Sport Chek Touché PHD! Montreal


    101.3


    7= Bully Ads Canadian Safe School Network Touché PHD! Toronto


    101.3


    9 Yasmin’s Sex-Ed Revolution Yasmin PHD Shanghai 96.7
    10 Like My Addiction Addict’Aide BETC Paris 87.2


    The world’s top 10 best agencies for media excellence

    Rank Agency Location Points
    1 MediaCom London, UK 317.2
    2 PHD New York, USA 249
    3 Mindshare Mumbai, India 235
    4 PHD Shanghai, China 211.4
    5 Mindshare Shanghai, China 197.4
    6 Clemenger BBDO Melbourne, Australia 184
    7 MediaCom Mumbai, India 174.9
    8 Mediaplus Munich, Germany 171.4
    9 Touché PHD! Montreal, Canada 171.3
    10 Starcom Chicago, USA 169.4


    The world’s top 10 agency networks for media excellence

    Rank Agency Network Holding Company Points
    1 MediaCom WPP 1360.6
    2 PHD Worldwide Omnicom Group 1199.5
    3 OMD Worldwide Omnicom Group 1140.8
    4 Mindshare Worldwide WPP 890.2
    5 Starcom PublicisGroupe 761.1
    6 Universal McCann Interpublic Group 731.1
    7 BBDO Worldwide Omnicom Group 546
    8 Wavemaker WPP 526.8
    9 Dentsu Aegis Network Dentsu 482.2
    10 McCann Worldgroup Interpublic Group 447.1


    The world’s top 10 holding companies for media excellence

    Rank Holding Company Points
    1 WPP 3565.4
    2 Omnicom Group 3326.7
    3 Interpublic Group 2131.7
    4 PublicisGroupe 1597.3
    5 Dentsu 540.1
    6 Havas 442
    7 MDC Partners 88.6
    8 Hakuhodo DY Holdings 65.1
    9 Publicis Group 41.4
    10 Accenture 17.1


    The world’s top 10 brands for media excellence

    Rank Brand Sector Points
    1 Nike Clothing & Accessories 297.5
    2 McDonald’s Retail 263.7
    3 Snickers Food 227.9
    4 Dove Toiletries & Cosmetics 204.5
    5 Netflix Media & Publishing 194.5
    6 Shell Business & Industrial 180.8
    7 Samsung Technology & Electronics 136.1
    8 Headspace Non-profit, public sector & education 129.1
    9 Gillette Toiletries & Cosmetics 122.5
    10 US Army Non-profit, public sector & education 107.3


    The world’s top 10 advertisers for media excellence

    Rank Advertiser Points
    1 Unilever 942.7
    2 Procter & Gamble 517.6
    3 Mars 392.8
    4 Nike 283.3
    5 McDonald’s 263.7
    6 PepsiCo 251.4
    7 Anheuser-Busch InBev 217.1
    8 Nestlé 195.7
    9 Netflix 194.5
    10 Royal Dutch Shell 186.5


    The world’s top 10 countries for media excellence

    Rank Country Points
    1 USA 2841.9
    2 UK 1427.5
    3 Australia 871.6
    4 India 854.8
    5 United Arab Emirates 748
    6 Canada 684.1
    7 China 656.8
    8 Singapore 363.2
    9 Brazil 345.3
    10 Germany 337


    Commenting on the results of Gunn Media 100, Emma Wilkie, managing director of Gunn Report, said: “Hot on the heels of the recently published Gunn 100 ranking for creative excellence and the WARC 100 index for effectiveness, the newly launched Gunn Media 100 benchmarks media creativity and innovation as well as highlighting media trends based on an independent global analysis.


    “We’re seeing that the smart use of data, event-led strategies and partnerships that provide new consumer reach are the main themes currently driving the media industry forward offering new and exciting opportunities in the market place.”


    The full Gunn Media 100 rankings – including the world’s top 100 campaigns for media excellence, top 50 agencies, networks, brands, advertisers, countries and top holding companies as well as commentaries, the work and credits – are available by subscription on www.warc.com/gunnreport.