Tag: Nielsen

  • Taboola report highlights readership gains made by media firms

    By A Correspondent


    Taboola, the discovery platform has released findings of its ‘Moments of Next’ research series with Nielsen. The findings reveal the shift in online news readership and content consumption pattern of consumers as it relates to Covid-19.


    Larger online audiences on publisher news sites:

    Since the WHO declared coronavirus a pandemic, Taboola readership data shows that news publishers have seen an uptick in traffic and engagement with content across the board, including an 8 per cent increase in unique readers, 14 per cent increase in page views and 25 per cent increase in time on page.


    News readership spikes in different categories:

    Globally, when looking at news readership over the past two weeks compared to the previous 10 weeks, we found large increases in the amount of time spent reading in Local news (63 per cent), Government and politics (62 per cent), Business (59 per cent), Technology (46 per cent), Lifestyle (31 per cent), Entertainment (18 per cent), Gaming (11 per cent)


    Consumers open to ads, as long as ads appear on trusted sources:

    In a new survey of 1,000 people about what they trust more in times of coronavirus, 4x more people trust advertisements on news sites compared to ads on social media websites.


    Consumers are more open to ads in certain mindsets:

    In general, the top moments where people admit to being open to information, including advertisements (their ‘Moment of Next’) are:

    Before going to sleep (31 per cent)

    Taking a break from work (17.5 per cent)

    In the bathroom (16 per cent)


  • Forced confinement leading to increase in TV consumption, but…


    By Indrani Sen


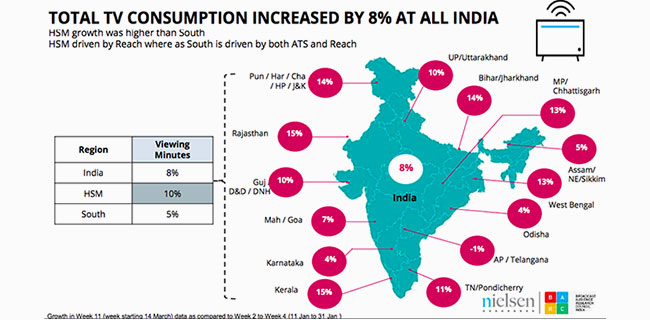
    On March 27, 2020 Nielsen and BARC India shared the first edition of their report “Covid-19 Impact- What’s happening in the TV and smartphone landscape” with the industry at large analysing how the lockdown has increased TV viewership in India. In the first week of the partial lockdown from March 14 to March 20 (BARC Week 11), the all-India TV viewership in minutes/week went up by 8% and TV reach went up y 6%. Overall time spent on TV went up by 2%.


    BARC conducts television audience measurement in India while Nielsen passively captures smartphone behaviour through a 12,000 strong smartphone panel. The time spent on smartphones per user also went up by 6.2%. The time spent/user/week on VOD apps saw an increase of 3%. News apps saw 8% more users per week with an increase of 17% in time spent/user/week stimulated by use of non-English News apps (+87%). Gaming apps saw an increase of 2% in users/week supported by 11% increase in time spent/user/week.


    We will look more closely at changes in TV audience behaviour. In Week 11, average daily viewers grew by 32Mn supported by kids, younger age groups and NCCS A. Viewing time for Television increased by over 70 billion minutes in India with each of 592Mn viewers watching TV daily for 3hr 51 minutes. Strangely, there was hardly any growth in the primetime viewership as the growth in viewership was driven by non-prime time. GECs also grew by 32% in non-primetime slots, but saw a 15% dip in the primetime slots which was higher (23%) in the Hindi Speaking Market (HSM) than the south Indian market (5%). An analysis by genres given below show that news, kids and movies gained the most in terms of daily ATS followed by infotainment, lifestyle and youth.


    Last week, Nielsen and BARC released the second edition of the ‘Crisis Consumption: An Insight Series into TV, Smartphone and Audiences’ report of Week 12 (starting March 21) where four days  coincided with the first week of country wide lockdown, showing an unprecedented growth of  298%  in TV news viewership. The increase in the viewership of news channels was accompanied by a 15% growth of average daily free commercial time (FCT) to 6 lakh seconds in between March 21-27 (Week 12) compared to January 11-31, 2020 or the pre-Covid-19 period reflecting last-minute changes in the allocation of TV budgets.


    All the parameters reported by BARC showed increases during Week 12 with the weekly viewing minutes (total number of minutes spent watching TV) touching 1.2 trillion. The number of people watching TV all seven days a week jumped from 32% to 44%, the average time spent per viewer increased 23% from 3 hours 46 minutes to 4 hours 39 minutes. As a result, the total number of channels consumed per viewer in the week also increased from 16 to 22. This surge is TV viewership is expected to continue during the next few days of the nation wise lock down and the spread of Covid- 19 in India will decide its future course.


    It is heartening to see that the news genre has been able to get additional advertising during this lock down period. Kids’ genre, with 20%+ share of total TV viewership and only 3% share of the overall advertising space, has not been so lucky. However, on the whole the prognosis is not good when we look at ad revenue of TV channels in immediate future. Going by the current trends, TV channels will hardly be able to convert this increase in viewership to increased ad revenue. Financial Express reported on March 21, 2020 (https://www.financialexpress.com/brandwagon/coronavirus-impact-ad-expenditure-to-decline-by-50-55-on-tv-between-april-june-2020/1914445/) “As the novel Coronavirus continues to wreak havoc around the world, television is one such industry which is currently under its grip, besides other sectors. According to industry estimates, advertising expenditure on television is expected to decline 50%- 55% to anywhere between Rs 3,750 crore – Rs 4,125 crore between April-June, that is Q1 FY2021 – if the lockdown continues.”


    The economictimes.indiatimes.com reported on April 2, 2020 in similar lines, though their estimate of the loss was pegged at 30-40% than 50-55% reported by Financial Times – “Top broadcasters, media buyers and advertisers ET spoke with, feel that if the situation doesn’t improve by end of April, the TV industry will end up with a 30-40% drop in ad revenues in April and May.” (https://economictimes.indiatimes.com/industry/media/entertainment/media/broadcasters-stare-at-drop-in-ad-revenues/articleshow/74937708.cms?from=mdr)


    While we wait for FICCI-EY to release an update of their report on M&E industry, FICCI’s recent report on the impact of Covid-19 on the Indian economy has predicted that the pandemic will potentially derail India’s growth story by affecting both the demand and the supply side. We are going through unprecedented times when it is extremely difficult to predict even the immediate future.


  • Television, Smartphone consumption leapfrogs


    By A Correspondent


    The disruption caused by Covid-19 continues to result in television viewership, smartphone usage and video-on-demand (OTT) consumption. Week 12 of the BARC ratings saw Total TV consumption skyrocket. This was determined in the insights provided by TV audience measurement body BARC and research major Nielsen on Thursday. The second edition of the ‘Crisis Consumption – An Insights Series into TV, Smartphone and Audiences’ was presented by the research bodies.


    According to the report, there has been growth in TV and Smartphone consumption across geographies, socio-economic classes and age groups. Television viewing in Week 12 stood at a record 1.2 trillion minutes and the average daily viewers grew by 62 million ad 622 million viewers watched television daily for four hours, forty minutes.


    The lockdown period registered many ‘firsts’ in television viewing history. News and Movies recorded an all-time high growth in viewership, in fact Hindi movies surpassed Hindi GECs The all-India consumption increase was 37 percent over the previous week. Viewership grew significantly post-lockdown on March 25, 26 and 27.


    Being the first week of lockdown there was a sizeable growth in all demographics, thought particularly amongst males. Non-primetime viewership surged by more than 70 per cent, and growth in Hindi-speaking markets was higher than the south.


    While movie channels along with News and Kids grew higher than GECs, the general entertainment channels grew in non-primetime by 32%. News saw a growth of more than 200 per cent. In fact the share of news to Total TV leapfrogged from 7% to 21% at an all-India level in both primetime and non-primetime.


    As for advertising, the average FCT in Week 11-12 grew 15 per cent – by 6 lakh seconds. Week 11-12 saw a growth across genres except for sports and youth.


    On the digital front, consumption of news continues to show a huge increase, and Chatting and Social networking show a significant increase in timespent. E=commerce though has suffer due to difficulties in logistics management in the lockdown


    According to the report, The re-telecast of epicserial Ramayan garnered the highest ever rating for a Hindi GEC show since 2015.


  • Covid-19 sees TV & Smartphone grow


    By A Correspondent


    Broadcast Audience Research Council (BARC India) went a step further on its attempt to offer a combined measurement of television and digital consumption. TV viewing minutes and Smartphone usage went up 8% and 6.2% respectively as BARC India and Nielsen unveil report on the impact of Covid-19


    BARC and Nielsen put together a report to understand the changes in consumption behaviour of television and smartphones given the extraordinary situation surrounding the COVID pandemic and its fallout.


    Sharing her views on the current surge in smartphone usage, Dolly Jha, Country Leader Nielsen Global Media, South Asia said, “We are living through unprecedented times! Physical Social Distancing seems to have led to a phenomenal growth in Virtual Social Togetherness with an almost 20% increase in time spent per user on Chats, Social Media and News in the last one week. And we anticipate this to grow further.”


    Elaborating on the topic, Sunil Lulla, Chief Executive Officer, BARC India said: “These are unfortunate and unprecedented times. Working closely with Nielsen, we bring for our customers and stake-holders, this very significant and important update, on change in content and advertising consumption behaviour, with a significant population at home. We will report soon enough, the impact of total lockdown. Our respective brave teams are working (WFH) round the clock to ensure the TV measurement currency, continues uninterrupted.”


    Highlights of the report:

    1. The Covid-19 disruption period has seen an increase in television viewership – 6% increase in TV reach and 8% increase in TV viewing minutes /week. The time spent on TV / viewer has seen a jump by 2%. The PM’s address to the nation on complete lockdown on March 24 garnered unprecedented viewership of 197 million watching it across the country.


    2. When we look at smartphone behaviour the time spent on smartphones per user has gone up by 6.2%. The time spent/user/week on VOD apps has also seen an increase of 3%. If we look at the increase in the time spent/user/week over that of the previous week (to take away the impact of Cricket viewing in the PRE COVID period considered), we can see a jump of 5%.


    3. Kids’ schools being shut and the stress of exams off their shoulders has resulted an increase in television viewing (+20%). With corporate India getting into Work from Home mode, NCCS A showed an 11% increase in viewership. Even on smartphone usage, the increase in driven NCCS A (+7.7%) and 35-44-year-olds (+10.7%).


    4. People staying at home led to watching TV throughout the day and hence the growth in TV viewing is coming from Non-Prime Time slots (8am – 5 pm).


    5. The need for continuous updates expectedly has led to a huge increase in news consumption on Television (57% increase in Impressions), while spending more time as a family together could be leading to the Movies genre and the Kids genre also showing significant increases.


    6. This behaviour is seen in digital consumption as well with News and Gaming showing huge increases. News apps saw 8% more users per week with an increase of 17% in time spent/user/week. This growth was led by non-English News apps (+87%). Gaming apps saw an increase of 2% in users/week and with a 11% increase in time spent/user/week.


    7. With a lot of uncertainty around what is happening, people have increased their time spent on Chatting (+23%) and Social Networking (+25%) apps.  Almost all social networking apps –  Facebook, Instagram and TikTok have seen significant increases not only in time spent /user/week but also in the sessions/ user/ week.


    8. Shopping apps, Travel apps and Food Apps have seen a huge drop in both users/ week and time spent/user/week.


    9. It’s not just TV viewership that has seen an increase –advertising FCT on TV has increased by 13%.


    Measurement considerations:

      BARC Nielsen Smartphone Panel
    Coverage All India (Urban + Rural) All India (Urban 1 Lakh plus)
    TG ALL NCCS 2+ years NCCS ABC 15-44 years

    Android Smartphone Users

    Time Period PRE COVID  – 11th Jan 2020- 31st Jan 2020 PRE COVID –  13th Jan 2020 – 2nd Feb 2020
    COVID DISRUPTION – 14th March 2020 to 20th March 2020 COVID DISRUPTION – 16th March 2020 to 22nd March 2020
    Week definition Saturday to Friday Monday to Sunday


  • 5 New MUST-DOs of Marketing


    By Lana Busignani, EVP, U.S. Analytics


    It’s no secret that marketing has undergone a massive transformation in recent years. Digital channels now capture over half of all advertising spending in the U.S. Understanding that marketing has changed doesn’t mean you know how to navigate the new landscape or what others in the field are doing to keep up.

    Nielsen’s second annual Marketing Report surveyed over 350 marketers from around the world to generate detailed findings that offer a powerful view into the current state of marketing. As the new decade unfolds, follow these five new truths of marketing to stay ahead.


    GUT FEEL DOESN’T CUT IT ANYMORE (AND PROBABLY NEVER SHOULD HAVE IN THE FIRST PLACE)

    Digital’s expanding influence means marketers have to be much more agile in allocating their precious media dollars, but calculating the ROI for digital investments can be tough. Our survey found that when the going got tough, investments in paid digital media channels became the product of gut feel more than quantifiable ROI metrics. This is a scary proposition when millions of dollars are at stake.

    While such digital marketing investments may indeed be worthwhile, it’s time for marketers to seek out measurement solutions to back up gut feel decisions and stop relying on assumptions. Partnering with industry experts can help organisations determine which digital marketing investments are, and aren’t, paying off.


    PAY ATTENTION TO DATA QUALITY

    When it comes to accurate measurement, the key to having high-quality output is having high-quality input. As the saying goes, “good data in, good data out.” Yet we found that audience targeting, ad creative, and audience reach are global marketers’ top three priorities for marketing campaigns. Data quality comes in fourth. Placing such a low priority on data quality dramatically increases the risks that your marketing investments will be less effective, or even worse, simply off-target.

    Marketers shouldn’t under-value the importance of data quality. Instead, they should focus on increasing data quality just as much as they focus on targeting and reaching audiences. After all, none of that targeting will hit the mark if the data that sustains it isn’t accurate.


    RE-EVALUATE THE ROLE OF PROMOTIONS

    Most of us have leafed through coupon books in the Sunday newspaper in search of a discount for a local restaurant, air-conditioning service, etc. Those one-for-all coupon books are good examples of what trade promotions used to be. But today, most consumers aren’t saving, clipping, or carrying around paper coupons. Instead, they’re using digital shopping apps, digital coupons and acting on personalized offers.

    In today’s digital marketing world, trade promotions are ripe for disruption. Now’s the time for forward-thinking organisations to re-evaluate the role of trade promotions for their brands. Prepare for tech-enabled promotions and use them to learn about your customers, including their motivations and shopping behaviours.


    START PREPARING FOR CONNECTED TV

    Connected TV has the potential to be a bridge between traditional and digital media, combining the reach and captive audience of TV with the addressability of paid search and video. To date, adoption has been hampered by various challenges, such as internal knowledge gaps, organizational buy-in, and media planning efficiency.

    But industry partners are ramping up connected TV measurement solutions and organizations need to sharpen their in-house skill sets to prepare. Good first steps include running small-scale campaigns as well as forming media and technology partnerships to hit the ground running when connected TV breaks open.


    REPRIORITIZE YOUR CUSTOMER PRIORITIES

    It’s human nature to like shiny new things, whether it’s a new gadget, a new city, a new marketing channel, or new customers. But that’s not always a wise strategy for customer retention.

    According to our survey results, customer churn is the last priority when it comes to companies’ marketing objectives. Believe it or not, many brands rank acquiring new customers as their top marketing objective instead of investing in and focusing on retaining existing customers.

    This lack of emphasis on churn is a missed opportunity for marketers. Studies have shown total spending is highly concentrated among a small segment of customers, proving that the 80/20 rule (that 20% of your customers drive 80% of your revenue) still holds true.

    With global disloyalty growing, brands need to adjust their marketing tactics and investments to boost retention. For marketers, that means segmenting high-value customers and developing media planning and messaging strategies for the best, not the rest.


    MAKING DIGITAL MARKETING INVESTMENTS PAY OFF

    With digital marketing, it’s impossible to slow down the rate of change. That’s why it’s vital to step back and make sure your brand’s digital marketing investments are paying off.

    Rather than relying on gut feel for what’s working, organizations should seek out partners that can help them quantify ROI for digital marketing, increase data quality for better marketing effectiveness, prepare for broader connected TV adoption, and identify ways to boost loyalty of high-value customers.


    Lana Busignani is EVP, U.S. Analytics at The Nielsen Company. This article was first published at https://www.nielsen.com/us/en/insights/article/2020/the-5-new-must-dos-of-marketing/?utm_source=sfmc&utm_medium=email&utm_campaign=newswire&utm_content=2-19-2020


  • Aligning RoI Perception with Reality


    By A Correspondent


    Nielsen’s Annual Marketing Report titled The Age of Dissonance sheds new light on how marketers perceive the effectiveness of digital and traditional channels, if their perception is driven by measurement data they can trust, and what ultimately influences budget decisions.


    Consumers’ path to purchase is growing more fragmented by the day. Marketers need to know which channels will effectively reach consumers along their journey in order to create the marketing mix that works best. Yet Nielsen found that investments in channels are often driven by a sense of effectiveness that isn’t entirely grounded in reality, leading to wasted spend and missed opportunities.


    The research, based on a Nielsen survey with marketers at more than 360 brands and agencies around the globe, found that:

    Marketers hold digital channels to a different standard than traditional channels, despite lack of confidence in ROI. Digital channels are perceived to be effective and invite more spending, even when that effectiveness cannot be readily verified.

    Data quality is a top priority for just 28% of respondents. Despite the benefits of using high quality data, data quality ranks low on the list of marketing priorities—well behind targeting, ad creative and reach.

    Marketers place a much higher priority on advertising than trade promotions. Most marketers discount the value of trade promotions, despite opportunities to use them to learn about their customers’ in-store purchase behaviours.

    Marketplace challenges are slowing the adoption of over-the-top (OTT) TV. To capitalise on the promise of OTT, brands must overcome internal knowledge gaps and partner with vendors to address measurement and media planning efficiency/ transparency concerns.

    Marketers prioritise new customers over old. Despite the value of existing customers, the majority of marketers are focused on acquiring new customers and increasing branding awareness, with just 8% of marketers focused on reducing churn.


    Said Matt Krepsik, Global Head of Analytics, Nielsen: “Marketers are seeking greater accountability in today’s increasingly omni-channel landscape, yet we learned through this study that their investments in media are often driven by perception versus reality,” adding: “The good news is that the industry is working hard to bring credible measurement solutions to market, not just to make sense of newer digital channels, but to provide comparable metrics across all channels. Only then can marketers think holistically and make smarter investments across the entire customer journey.”


    The survey responses were collected between January and March 2019. The sample consists of 247 brand executives and 116 agency executives for a total of 363 respondents, with nearly 80% of participants at the Director-level and above.


    For more key findings and recommendations for marketers, please download the report here.


  • Nielsen adds measurement for Youtube Mobile

    By A Correspondent


    Nielsen has announced it has expanded advertising measurement on YouTube’s mobile app with Nielsen Digital Ad Ratings to 26 additional countries that includes India.


    Said Dolly Jha, Head – Media, Nielsen South Asia: “As more people watch video across digital platforms and devices, Nielsen’s comprehensive measurement of YouTube through Digital Ad Ratings is crucial to provide a complete picture of media consumption, especially since YouTube accounts for a large share of mobile video advertising in these countries.”


  • The IRS 2019/Q1 Toplines Deck: Print continues to expand; total number of readers touches 42 crore

    Print continues to expand; total number of readers touches 42 crore… that was the headline of the IRS 2019/Q1 presentation. Since the readership numbers are all topline, there isn’t enough that we can write about them. So here’s the presentation deck that the MRUC and Nielsen big bosses made to the media on Friday, April 26.


    IRS 2019 Launch Deck

  • Ipsos hires Sreyoshi Maitra as ED

    By A Correspondent


    Sreyoshi Maitra

    Ipsos has hired Sreyoshi Maitra in a senior leadership position, as part of its Delhi cluster. Designated Executive Director, she will also lead the Shopper Practice for Ipsos India and will report to Krishnendu Dutta who leads the Delhi cluster for Ipsos.


    Maitra moves from MRSS and has previously held senior level positions with Nielsen, Kantar IMRB and Kantar Milward Brown.  Her expertise covers a vast number of areas in both Consumer and Shopper behaviour, and also ROI on Channel spends.


    Her remit is for key Ipsos clients in Delhi and NCR, though for Shopper Practice her repertoire of clients would extend across geographies of India.


    Krishnendu Dutta

    Said Krishnendu Dutta, Delhi Cluster Lead for Ipsos:“With her wealth of domain expertise and experience, Sreyoshi will play a key role in deepening our relationship with clients, further bolstering our position in the market.”


  • Advertisers on FIFA World Cup 2018 & IPL 2018

    TAM Sports, a jv of Kantar Media and Nielsen, tracks leading sporting events. In the set of tables below, we have a list of the leading categories, advertisers and brands across the television coverage of the 2018 editions of FIFA World Cup and the Indian Premier League (IPL).
  • Nielsen’s Gracenote automates TV channel monitoring with TV Street Maps 2.0

    By A Correspondent


    Those who’ve been following MxMIndia’s reports on the implementation of Phase 1 of digitisation, will remember the work done by TV Street Maps. The company, then owned by AtulPhadnis, has now transitioned with Phadnis having sold it to Gracenote, which in turn is now a Nielsen company.


    TV Street Maps has been involved in the crazy exercise of TV channel monitoring. Simply put, it would mean tracking connectivity (read availability) of TV channels in cable networks across India. But the situation on the ground demanded a more robust monitoring mechanism and given the Nielsen parentage, Gracenote went ahead to develop a proprietary distribution monitoring and reporting solution developed specifically for the India TV market. Called TV Street Maps 2.0.  The will get Indian broadcasters an as-accuratte-as-possible picture of TV channel distribution and delivery to preserve programme ratings, address technical challenges in near real-time and improve monetisation from cable operators. Minus manual intervention.


    TV Street Maps will track over 90 per cent of digitally connected cable TV households by next month. It already tracks over 650 of the 950+ digital headends. The challenge is that each operator can add, remove or change the position of channels at their discretion and without notice to broadcasters. On average, there are approximately 300 to 350 channel line-up changes occurring every week. These changes can impact tune-in, significantly impair ratings and inaccurately calculate cable operator carriage fees for broadcasters.  The automated version of TV Street Maps ensures that the reporting is daily and broadcasters know exactly where they stand.


    Said Geet Lulla, Managing Director of India, APAC and Middle East in a statement: “As India continues its digital transformation, we are now tasked with creating the next generation of tools, platforms and services that will help monetise viewership across the digital video ecosystem. With TV Street Maps 2.0, Gracenote is giving broadcasters the ability to more easily and effectively monitor their channels, analyse channel positions and provide a means to audit digital operators in near real-time.”


  • How Emotions Influences Advertising


    Using Consumer Neuroscience To Create Winning Campaigns

    By Dolly Jha and Moumita Ghoshal

    Numbers have long been known to be coldly accurate but thoroughly incapable of assessing softer aspects like emotions and feeling. However, ensuring that audiences connect with brand messaging is the next frontier of effective measurement.

    Today’s consumers access content across myriad media, but consumers in India continue to view television commercials to be among the most trustworthy sources of advertising. Given the prevalence of TV in consumers’ lives, however, viewers are bombarded with more ads than ever, making it that much more difficult for brands and agencies to create commercials that truly connect with their audiences. So what’s involved in building that connection?


    The media industry has a long history of measurement solutions that assess an ad’s impact on its intended audience—understanding what works and what doesn’t. But they don’t determine whether an ad creates an emotional connection with the viewer. This represents a significant opportunity for marketers because studies show that purchase decisions are driven by emotions.


    Measuring Emotions

    Emotions are intangible, and measuring them is no small task. Direct response surveys can be misleading because they presume that respondents can accurately verbalise their emotions. Verbal responses require respondents to express, and therefore rationalise, their emotions as feelings. Emotions are instinctive reactions to external stimuli, whereas feelings are the mind’s interpretation of those emotions; and are therefore, subject to personal bias, culture, setting, past experiences and ingrained beliefs. Moreover, many emotions don’t break the surface of conscious awareness, making it impossible to be interpreted as feelings.


    For many modern researchers, using techniques that can directly measure neurological and biological reactions are the best way to evaluate emotions. These reactions can include heart rate, sweat, posture, facial reactions, electrical impulses in specific regions of the brain, etc. Those techniques are collectively referred to as neuroscience, and recent technical innovations in this field are helping break new ground in our understanding of consumer behaviour. They’re also setting a new standard for ad testing.


    Using Neuroscience For Ad Testing

    Neuroscience provides a deep, clear view into the real world—the real-time reactions of consumers at the most elemental level: their brainwaves. The human brain reacts to stimuli in milliseconds, and by capturing these reactions deep within the subconscious, consumer neuroscience can reveal exactly how consumers perceive brands, marketing and the message—at the most granular level. Pure, instantaneous, unfiltered responses measured at the subconscious level of the mind offer far more accurate and reliable insights than other consumer research methodologies.


    As of today, the complete neuroscience toolkit includes EEG, core biometrics such as heart rate and skin response, facial coding and eye tracking. While EEG provides detailed second-by-second diagnostics on the effectiveness of the stimulus, biometrics provides the depth of engagement and facial coding reveals the depth of expressed emotion.


    While all of these predict sales to some degree (EEG being the most predictive of them all), a combination of all these neuroscientific measures provides the highest level of prediction – almost 77%. While articulation in itself is much weaker in terms of predictability, when integrated with the combination of neuroscience tools enhances the predictability to almost 84%!


    This clearly establishes how consumer neuroscience scores over articulated research responses, which fail to indicate with sufficient level of precision, which of the aspects of a brand and marketing are going to work, and which ones aren’t.


    Consumer neuroscience measures two sets of neurometrics.


    Primary metrics result from real-time activity in the brain.

    :: Attention: It is a measure of how much brain energy one has to devote to decipher what is being shown to them.

    :: Emotional Engagement: This indicates the extent to which the respondent is ‘drawn’ to the stimulus. It is the assessment of whether one is approaching or avoiding what they are seeing, and is by far the purest form of measuring how connected they feel with the stimulus.

    :: Memory Activation: This metric indicates the extent to which new memory connections get formed (encoding) or past memories are aroused (retrieval).


    Secondary metrics result from the interplay between two or more primary metrics.

    :: Overall Effectiveness: It indicates the holistic appeal that the stimulus is able to generate

    :: Action Intent: This is the likelihood of a change in behaviour or intent to act on a message.

    :: Comprehension: This indicates the extent to which the experience is understood or the extent to which it makes sense.

    :: Novelty: It is the likelihood of the ad standing out and being embedded into memory.


    A growing number of researches validate the fact that neuroscience based measures are predictive of sales. Findings from a study of 100 recent ads across 25 brands in the fast-moving consumer goods (FMCG) industry demonstrate how ads affect sales. The ads in the study were grouped into three buckets according to how they scored on a metric based on people’s electroencephalogram activity (EEG) while viewing the ad (‘Below Average, ‘Average’ and ‘Above Average’). Using robust marketing mix modelling, each ad’s contribution to sales volume was computed against the average ad for that brand. Overall, it was found that ads which generated above-average EEG scores were associated with a 23% increment in sales volume over what an average ad would generate. Similarly, below-average ads were associated with a 16% decline in sales volume.


    Case Study: Vodafone

    The predictive ability of neuroscience measures isn’t restricted to the FMCG category alone. Savvy marketers with brands like Vodafone in the telecom category also use the principles of neuroscience to engage with consumers powerfully. A recent ad under the Vodafone SuperNet™ campaign, Vodafone Super Dad, delivered a healthy performance on all the critical neurometrics including overall effectiveness, action intent, and emotional engagement. The brand uses various technologies to assess and deliver a superior experience to its vast spread of customers across the country.


    The brand received positive audience feedback beyond internal expectations. Neuroscience-based research also showed that the appeal and engagement levels were heightened further whenever the brand was referenced in the ad; indicating a positive association with the brand.


    The study demonstrated that it wasn’t just one segment of Vodafone’s ad, but a positive contribution of most segments that led to its good performance. The ad not only benefited from a really strong start, priming the audience positively to the rest of their viewing experience, but it was able to keep the audience engaged through most of its critical segments. That enabled effective registration of the message.


    Emotional Engagement Scores

    Research algorithms are able to automatically extract compressed versions of the ad based on neurological optimality to achieve the desired output to create the same bang but at a lesser cost. Validations have shown that 95% of scientifically-compressed ads perform as well, or even better than the originals.


    This granular second-by-second deep-dive into the ad equips advertisers with specific, immensely actionable insights. Consequently, understanding which portions to remove and what to retain for effective shorter edits could become much more profitable.


    With such strong and predictive analysis, neuroscience measures are clearly the way forward today for copy-testing applications across categories.

     Dolly Jha is Executive Director, Nielsen India and Moumita Ghoshal is Director, Nielsen India. Reprinted with permission from Nielsen India