Tag: GroupM

  • The Gradual Shift From Age & Gender to Audiences


    By Brian Wieser


    Most of the world’s largest marketers focus on age and gender when they plan and buy media. This is especially true for campaigns designed to build brands and even more true for those which rely on video. To meet this focus, demographically-based audience guarantees were established as a standard transaction term, and they persist as a means for helping marketers prioritise which inventory they want.


    Trading media based around audiences within a limited range of age and gender, understandably, had innate appeal when media companies began offering the delivery guarantees, most notably in the US television market in the 1960s. At the time, marketers had relatively less sophisticated ways to identify their target audiences, and probably didn’t need to do so given the novelty and intentionally widespread appeal many of their products had in that era.  As time progressed, new brands targeting narrower groups of people emerged, and existing brands evolved their businesses to more appropriately focus on the differing characteristics of their customers and prospects. These attributes included life-stage, complementary product ownership, geography or any of a myriad of other elements.


    Media owners and marketers indicate they want to change. While television-based media owners were probably content to trade as they did through most of the 20th century, over the past two decades many of them began to express an interest in transitioning away from age and gender-based conventions. Core demographic groups (adults 18-49 or adults 25-54) weakened while broader audiences were relatively stronger; media owners generally came to believe that they could more efficiently sell their inventory if they were better aligned with the criteria marketers actually use in their business planning.   Increasing numbers of buyers – agencies and marketers’ media directors – also became inclined to believe alternative media trading conventions could be superior, especially if doing so might help them to more efficiently manage their media budgets. The proposition for consumers was also potentially going to be favourable, especially if advertising was made more relevant to viewers’ actual needs and interests.


    But change is difficult; TV media buying conventions are mostly stuck on age and gender for very practical reasons. Even where marketers have changed how they manage their businesses, sources of friction with processes for buying media persist. They include marketers’ needs to establish and beat historical media pricing benchmarks; the belief that propensities to buy products are formed during specific ages; the difficult efforts required to persuasively demonstrate that changing approaches and workflows can offer tangible benefits; and the need to determine new approaches required to allocate budgets. Making all of this harder: attribution modelling limitation; long time horizons required to properly assess alternative approaches; and the inability (or unwillingness) of many large brands to properly perform the controlled tests required to prove the superiority of such changes. All of these factors help to explain why demographic conventions persist.


    Change will be incremental unless marketers and media owners taking bigger risks. None of this is to say that audience-based buying will not become increasingly important with every passing year. As the younger demographic groups advertisers prioritise account for falling shares of TV audiences, and as reach and frequency-based metrics become increasingly expensive and harder to manage against these groups, marketers will show greater urgency in looking for new ways to prioritise their media investments.  Some marketers will make changes in any given year because of these factors, although the fragmented nature of marketers relative to media owners means that no one marketer can cause a noticeable change for the industry.


    By contrast, the supply side – media owners – are probably better positioned to force changes more widely and more rapidly, at least theoretically.  For example, they can refuse to offer audience guarantees based on age and gender. This is already occurring on a small scale (some refuse to offer audience guarantees against adults 18-34 because delivery can be so hard to predict). Doing this across all of a network owner’s properties would be very risky. Some marketers unable to alter their internal conventions might shift spending to other media owners, initially. However, this would concentrate demand with those advertisers who do offer guarantees and cause the recalcitrant marketer to effectively pay higher prices. Marketers would be compelled to adjust tactics in time, at least if the inventory now only available on a non-age-gender-basis was sufficiently significant. Alternately, a media owner could potentially reduce the risk of revenue loss by finding ways to incentivise marketers – and incurring significant one-time costs – to make changes.  Either way, bold actions are needed to cause accelerated industry evolution.


    The transition away from cookies in digital advertising may show what a “big bang” change looks like. An interestingly similar experiment is likely to play out in digital media over the next couple of years.  With news that Google would deprecate cookies from its dominant Chrome browsers (following on similar actions from other browsers), marketers are going to be forced to establish alternative ways to target, measure and manage the audiences they buy online. The similarities to the situation television has with age-gender targeting could be even stronger when we consider the widely-known limitations and flaws of using cookies. Nonetheless, the industry still requires someone to effectively force them to go away.


    Change is typically incremental in any industry. This is especially true in advertising as the industry is dependent upon marketers whose organisations are complex, internally and across external partner relationships. Radical changes can eventually take root, but only to the extent that a change is widely viewed to be substantially better than alternatives. Companies looking to drive change quickly need to demonstrate the advantages or otherwise find ways to worsen alternatives.  In lieu of that, change will occur, but the pace will likely be gradual.


    Brian Wieser is Global President, Business Intelligence GroupM. This article was first published at https://www.groupm.com/news/gradual-shift-age-gender-audiences

  • 10.7%: GroupM forecast for AdEx 2020


    By A Correpondent


    GroupM formally announced its advertising expenditure (AdEx) forecast for 2020.  As per the GroupM futures report ‘This Year, Next Year’ (TYNY) 2020, India will continue to top the list as the fastest-growing major ad market in the world. TYNY forecasts India’s advertising investment to reach an estimated Rs. 91,641 crores this year. This represents an estimated growth of 10.7%, for the calendar year 2020.


    India will continue to be the third-highest contributor to the incremental ad spends, only behind UK and USA while China drops to the fourth spot and the eight fastest-growing country with respect to ad spends across the globe.


    Commenting on the TYNY 2020 report, Prasanth Kumar, CEO – GroupM South Asia said: “We expect the global AdEx to grow by 5.1%. The Indian media landscape is constantly evolving, will continue to witness the fastest growth of 10.7% to reach Rs 91,641 crores. While we expect sustained and stable investment across media in India, Digital to garner 65% of incremental ad spends in 2020. In 2020, India faces challenges and uncertainties across sectors just like other markets. However, this also brings opportunities for brands to innovate because of which we see an evolving media stack. This will be propelled by greater use of technology and better content across media.”


    Digital secures #2 position as the most used media vehicle and is estimated to reach 30% of adspend in 2020 with growth coming from 3Vs (video, voice, vernacular-Indic) and advertising on e-commerce. The growth of digital is set to soar high because of changing consumer habits.


    Added Tushar Vyas, President Growth and Transformation – GroupM South Asia: “There are multiple advancements happening in technology which is transforming digital advertising and other mediums. India being a diverse country, digital will keep growing, especially with the rise of content platforms and its availability in multiple languages powered by the growth of 3Vs. From a predominantly ‘at home’, ‘urban’, ‘English print’ & ‘TV’ consuming market, the Indian media consumer evolved to include ‘on the move’, ‘rural’ & ‘regional’ counterparts, experimented with digital media in the early 2010s’, adopted social media in middle of the decade and started consuming digital videos voraciously after 2016.”


    Even with an overall slowdown in the global economy Indian media spends are expected to be between low to moderate in H1, with robust growth anticipated in H2 2020.


    Said Sidharth Parashar, President – Investments and Pricing of GroupM India: “The format of print storytelling is changing but the content is still the strongest. With print media organizations undergoing transformation across India. Publication houses have invested heavily in promoting digital subscriptions and have started limiting access to digital versions of epapers. We believe that this would pave the way for newer business models. Print will continue to remain relevant to advertisers wanting to build credible brands. Television will continue to grow at a steady pace. This year, the growth rate for TV is estimated to be 7% and Radio is expected to grow at 6%. While cinema and OOH will grow at 15% and 6% respectively in 2020.”


    OTT has seen a faster evolution in India, which is now complementing television. OTT hybrid models looking at both advertising and subscription will continue to be an effective model.


    Speaking on the trends for the year, Ashwin Padmanabhan, President – Partnerships and Trading of GroupM India said: “While there are challenges and uncertainties in the market, it is a world of abundant opportunities in the content eco-system. This gives us vibrant options to reach and engage with consumers. It necessitates us to be agile, invest in new-age talent and technology while keeping an eye on the future. The key is to be always prepared while we are shaping the media landscape.”


  • Omnicom Media Group Kartik Sharma to helm Omnicom Media Group in India

    Caption: Photo Montage: Rafiq Barak. It may be noted that Kartik Sharma will join OMG only in mid-2020.


    By A Correspondent


    It’s now confirmed. Omnicom Media Group has appointed Kartik Sharma as CEO for its operations in India. Sharma joins the Omnicom entity from GroupM’s Wavemaker, where he was most recently CEO for South Asia. He is slated to join the network mid-year. His exit from Wavemaker was announced on Wednesday (January 29). The position was created after former OMG CEO Harish Shriyan’s exit was announced in July 2019.


    With over 25 years of media experience under his belt, Sharma has served in a leadership capacity at some of the largest agency networks, including Mindshare, Lintas Media, Madison Media and Maxus and managed clients such as L’Oreal, Mondelez, Netflix and Vodafone. In his new role, Sharma will work closely with Priti Murthy, CEO of OMD India, and Jyoti Bansal, CEO of PHD India, on chartering the continued growth of the agency brands in India.


    Speaking on the appointment, Tony Harradine, CEO of Omnicom Media Group Asia-Pacific, said in a statement: “A revered leader with an impressive track record, I am thrilled that Kartik has joined us. I have the utmost confidence in his ability to steer our business to even greater heights in one of the most important markets in Asia.”


    For those not in the know, Omnicom Media Group is the media agency network owned by Omnicom, the global. advertising services conglomerate. According to a report in Campaign, OMD occupies the top spot by projected billings in the COM vergence 2019 global billings rankings report. GroupM’s Mindshare is second in the ranking and Carat is #3. In India, GroupM occupies the top slot amongst media agency networks, and OMG is as of now perhaps at #5.


    Clearly, Sharma has his role cut out for him. He took charge of Maxus from Ajit Varghese in January 2014 and there has been no looking back since. Sharma has led both Maxus and Wavemaker to winning the coveted Agency of the Year title at the Emvies.


  • Habitual Analysis: How We Study the Media Industry


    By Brian Wieser


    Key takeaways: Analyzing the media industry – or any industry – well depends on efforts to understand where and how relevant information is produced, testing ideas, and building models (conceptual ones, if not spreadsheet-based ones) in order to focus on the data and the associated insights that matter.  We review some of our best practices in this week’s note.

    January is always full of announcements, whether at CES, other trade shows, or with public companies revealing key initiatives ahead of or during earnings. This means it’s also a particularly important time to analyse the news well rather than take every piece of information in at face value. I was recently asked how we go about doing this work, and in response, I identified several habitual actions that help with our analyses. Some of these approaches may be useful to others who also need to form views on a given topic. We can loosely organise them into three groups:

    a) Understand where and how relevant information is produced.
    b) Test ideas and observations and refine analyses with other people.
    c) Build models and gather requisite data to firm up your ideas and concentrate on the data and the associated insights that matter.


    Understand how information Is produced and how it makes its way into news or content that may inform analysis. Much of what we think we know about our own industry comes from reporting in the trade press and through general business news, while other information comes from academics or from thinktanks. Often, reporting may have started with a press release, through public / government records, or through work originally produced by other news organisations. In some instances, news may have originated because a company has provided a publication with information either uniquely or broadly, and in other instances, reporters may have performed their own research, outreach and interviews. Different participants in the news-generating process may have different motives for participating (or not participating) with varying degrees of forthrightness, and different publications have different thresholds for assessing and including or omitting pieces of information, which can get repeated in all subsequent reports. As an example, in 2011 a prominent consulting firm prophesised that by 2017 CMOs (Chief Marketing Officers) would spend more on information technology than CIOs (Chief Information Officer or Chief Information-Technology Officer). While the direction of the report wasn’t wrong, few bothered to note that the underlying survey was focused on high-tech organisations, not companies across the different sectors, and the interpretation of the report was applied more broadly than was likely intended.


    • Be conscious of basic statistical measures and data gathering processes. When we hear of surveys that indicate a preference one way or another for a given population, what we often need to know is what the distribution curve looks like.  And even when the questions asked have binary yes/no answers, we need to know how, if at all, the sample might be skewed or non-representative, and what the sampling error is. More fundamentally, be mindful of biases in different processes for gathering information and then try to understand how information was gathered. For example, surveys performed using mobile phones will have a different skew than surveys performed using land-lines; passive media measurement panels will always be more accurate than self-reported media measurement. Further, different countries will have different cultural biases in different kinds of responses that may make cross-country analyses difficult.


    • Question what you know (or think you know). Far too often, conventional wisdoms persist and sometimes dominate. This can be because those wisdoms may have reflected the best ideas of the past, given limited availability of better data, or because ideas which sounded plausible were never tested. Or, perhaps they were truths under some circumstances but not under all. Of course, sometimes those conventional wisdoms are actually true even if they were never formally tested. Great examples often live on in the form of clichés.


    Test ideas and observations and refine analyses with other people. Ask “dumb” questions; try to prove your ideas wrong. Sometimes the questions that an individual has when studying a topic for the first time are the questions that no-one else has dared to ask, perhaps because of a perception that everyone knows the answer. Those questions are often the best ones to ask because they may relate to topics which have gone unchallenged. Relatedly, if you think you have an interpretation of a fact that is not widely held, ask practitioners with opposing views to poke holes in that interpretation. The relative success or failure of that effort will help to reinforce or counter your view. And, even if the conventional views turn out to be well-founded at the present time, they won’t necessarily hold for all times.


    • Interact with practitioners at all levels within the industry. When trying to prove ideas wrong or more generally looking for broader points of view on a given topic, consider that sometimes the most knowledgeable people will work in parts of the industry which are less credentialed (because of formal education levels, corporate affiliation, titles, etc.). Such individuals can serve as go-to experts, in part because they are less exposed to the group-think that can dominate other parts of the industry or because they are on the frontlines.


    • Explore similar ideas from other industries. To the extent possible, it can be helpful to talk to experts in other industries about similar concepts that might exist in unrelated industries, as lessons learned in those other industries might help to better understand our own.  This will be especially true when trying to study issues which are opaque and understood in-depth by relatively few people.


    Build models or think in terms of models you would use to describe what you are observing or expecting. While spreadsheet models aren’t necessarily the goal of every given analytical exercise, it is very useful to think in terms of models because of the numerical discipline imposed by them. Toward those ends, it is worth remembering that a model is meant to be an abstraction of reality, and all analytical work can help capture inputs which help to build that abstraction. Often, numbers around a given topic are available, but if they are not the true drivers of the model, they should ignored. Research should focus on finding ways to estimate the numbers that actually drive the behaviours we are trying to model. As a general rule, when an actual model is needed for making decisions, it is beneficial to build one’s own models, but if it is not possible and someone else is responsible for model building, it’s still important to understand the model in depth — and spot-check the math (perfect models are an ideal, but rare in reality).


    • Relative-size things as you go, when you can. Whenever a claim is made around a dollar figure, for example, compare it to a broader industry or the overall economy. For example, billions of minutes of time with a given service among a group of people over a given number of days or months could be compared to all activities or all consumption of a medium such as television. All spending on a given product could be compared to the size of the broader industry that product is part of, or possibly the overall economy in the countries that product is available in.  As well, be conscious of inappropriate comparisons: for example, comparing the value of a company or asset to the GDP of a nation is essentially never analogous, as one is a figure determined at a fixed period in time based upon an accumulation over all periods of time, while the other is a metric based upon a flow of money over a limited period of time.


    New information is often provided by companies looking to put their best foot forward when they communicate information; journalists almost uniformly try to produce what reporter Carl Bernstein described as “the best obtainable version of truth.” Such truths commonly inform perceptions of reality, although there can still be gaps between some press reports, what the industry believes and reality. While the actual truth may be elusive to everyone in some instances, efforts to find it are helpful for participants within an industry. Doing so helps everyone better understand the environment, make better decisions as competitors, customers and suppliers — and ultimately help make the industry both more efficient and more resilient.


    Brian Wieser is Global President, Business Intelligence GroupM. This article was first published at https://www.groupm.com/news/habitual-analysis-how-we-study-media-industry

  • Starcom bags Rs 100 cr Upgrad account

    By A Correspondent


    Starcom India has bagged the media strategy and buying of Upgrad, one of the country’s largest online higher education companies. The mandate, which had been bagged by GroupM’s Essence last year, that has now been awarded to Starcom does not include digital.


    The Ronnie Screwvala-co-promoted edtech venture has a Rs 100 crore marketing campaign and this appointment is part of the first phase of the same. With an ambitious branding and communication roadmap,  the first phase in this roadmap targets Tier 1 and Tier 2 cities pan-India, across online and offline media. The media efforts would be directed to drive awareness and preference for Upgrad.


    Said Rathi Gangappa, CEO of Starcom India: “We are elated at winning the media mandate of the leader in the online education space. Upgrad was impressed with our strong, differentiated approach to planning, especially in the area of television, where we will look to drive significant and measurable ROI. The Starcom Human Experience (HX) premise and messaging, as well as our rich analytics and tech capabilities will bring in a huge impact for Upgrad on their media investments.”


    Added Upgrad Co-founder and MD, Mayank Kumar: “Online as a category is growing at a fast pace. Our campaign round the year in 2020 is to create larger awareness in the working professionals’ group on the urgency of constant learning, what we at Upgrad call LifeLong Learning.  We decided to partner with Starcom since their team stood out with their data-centric approach and ability to deliver on core business KPIs. They were able to demonstrate an effective, integrated approach to planning where all media is used to grow both short-term and long-term prospects.”


  • Starcom appoints Anil Shankar as VP, Digital Media Solutions

    By A Correspondent


    Anil Shankar

    Starcom India has announced the appointment of digital leader Anil Shankar as its Vice President, Digital Media Solutions.


    Shankar has more than 16 years of experience in digital marketing and technology working across digital media platforms. He most recently served as lead of Programmatic Sales at Times Internet and has also worked with leading media companies such as WPP, GroupM and Affle.


    Rathi Gangappa

    Said Rathi Gangappa, CEO, Starcom India: “We are delighted to have Anil join us. He brings a wealth of digital expertise, strong leadership and new perspectives to Starcom and will lead our overall digital agenda, vision and offering. His extensive experience across agency, client and publisher ecosystems makes him an invaluable asset. Anil is passionate about Starcom’s Human Experience approach,  future-facing work streams and culture of collaboration. He will add tremendous value to our clients.”


    Added Shankar: “These are thrilling times. We have merely scratched the surface of digital possibilities. From banners to big data, big screens to mobile screens, even our smallest of towns are getting digitally equipped. This makes India the most exciting digital market in the world. I am confident that Starcom’s robust client portfolio, talent, infrastructure with strong technology and programmatic solutions will surely help in further deepening the client’s confidence.”


  • The Year Ahead in Internet: GroupM

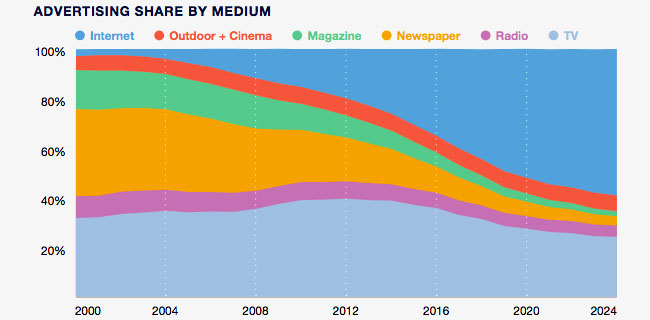
    Global Internet Summary Internet-related advertising is now unambiguously the most important medium globally, with $326 billion in ad revenue during 2020, up from $294 billion in 2019.

    Accounting for 52% of global advertising tracked here during 2020, digital is taking share of advertising in almost every country in 2019 and should do so in all of them in 2020. Digital should account for 34% of total advertising in the median country, illustrating further opportunity for growth. However, the weighted average is higher because of the relative importance of digital within larger countries, with digital accounting for more than 60% of total advertising in several markets, including China, the U.K., Sweden and Denmark. Share gains will rise beyond 2020, as global digital advertising should grow by high-single digits in subsequent years (following +11% growth in 2020, +15% in 2019, and +18% in 2018%).

    Assessing market share estimates for key media owners is challenging.

    Interestingly, the bottom-up (country-by-country) estimates for digital advertising tracked here amount to approximately $230 billion in 2019, outside of China. At the same time, we can see from public data that Google and Facebook are likely to generate somewhere around $175 billion on a net basis, or perhaps around $210 billion on a gross basis.

    Other large sellers of digital advertising—including Microsoft, Amazon, Verizon, Twitter and Snap—will generate approximately $25–30 billion in digital ad revenue this year, and there are undoubtedly other sellers of digital advertising whose revenues would amount to at least that much.

    Making detailed analyses of market shares will be subject to interpretation for several reasons:

    Significant amounts of ad revenue in countries around the world originate in China (“the China export market”) and relate to international e-commerce sales from small businesses based in China. These activities may not be fully accounted for in individual country estimates.

    :: Significant amounts of ad revenue are directed to countries such as Ireland— especially from small businesses—where many of the world’s largest digital media companies maintain European or international headquarters. It is possible that some of this spending will not be fully accounted for in individual country estimates either.

    :: In some countries where digital spending is allocated to an owner of traditional media properties, digital activity is included in the traditional media line (our guess is around $10–20 billion in total), reflecting the often blurry nature of digital and traditional media. For example, in some countries, premium video delivered over internet-based connections may primarily sell through digital rather than traditional channels. In other countries, that same type of advertising may primarily sell through traditional channels.

    Digital-first brands have driven much of the sector’s growth. As we imply above, much of the growth in spending on digital advertising in recent years has been driven by digital-first brands, whose own business growth rates should necessarily slow as they mature and see their growth rates converge with the rest of the economy. However, most large brands will continue to rely on digital media to supplement brand-building activities that are often centered on TV or other offline activities, focusing on the use of digital media to drive deeper engagement with consumers who may already have a view on what a brand means to them.

    Of course, digital media has the capacity to build brands, subject to an appropriate creative strategy. Then again, ongoing challenges remain around digital media for brands, including the increasingly “toxic” environments of platforms that do not curate content or other advertisers, with the widespread availability of inauthentic content (including fake ads) and other polarizing or extreme content. Measurement remains another problematic issue, as fragmented, incomplete and often low-quality sources of data make it difficult to assess the metrics that brand-focused marketers want to rely upon in order to manage their budgets well in digital environments. The big question is whether or not brand building is the focus of brand owners into the future. It may not be.

    Business transformation efforts from traditional brands will orient those companies’ media plans toward digital media. As brands increasingly invest in digital business strategies—business transformation, for lack of a better term—including direct to-consumer concepts, sales via third-party e-commerce channels, and focus on driving consumers to digital experiences (including websites or branded content), more growth in spending on digital media will occur. At this point in time, most brands generate only a small percentage of their revenues from e-commerce, but there are some brands pushing toward half or more of their revenues or consumer relationship activities from nontraditional environments, demonstrating possibilities yet to emerge. Of course, some categories will never be meaningfully digital (gasoline for automobiles is one example), and growth trends will not be evenly distributed around the world, as some countries will widely adopt new business models sooner than others.

    What are the implications for marketers? One’s view on the pace and potential  scale of business transformation in a given country should inform one’s view on the future growth rate of digital advertising. If business transformation will be slow—whether because of friction in a country’s labor laws, lack of competition among companies in key sectors, or limited broadband access—digital advertising growth will be relatively slow. If business transformation is more rapid, growth in digital advertising will be more rapid. Arguably, business models might emerge because faster and cheaper mobile broadband services will contribute to rapid digital media brand interactions.

    Where this is true, marketers will benefit from identifying preferred long-term media owner partners likely to have high-quality digital media inventory over a multiyear time period, as the most premium inventory will become scarcer as time progresses. On the other hand, in markets where business transformation is only going to move gradually— and where digital advertising growth is slower—securing long-term access to high quality inventory will be less important.

    Global Outdoor, Radio and Print Summary Beyond TV and digital—which combine to account for approximately 80% of all advertising—other media face a general problem of simple math: An advertising economy growing at low- to mid-single digits, with digital growing at least twice that rate, does not leave much opportunity. However, other media may offer real benefits and maintain the potential for faster growth in the future than in the recent past, especially as they develop their own directly related digital assets.

    Outdoor advertising is growing faster than the rest of the industry, aside from pure play digital media. Our updated estimates for outdoor advertising—a sector with $39 billion in global ad revenue during 2019—indicate growth slowing from +5.3% in 2018 to +1.8% this year, +2.5% in 2020, and 3–4% growth rates in most subsequent periods.

    Importantly, these growth rates mask more robust health outside of the world’s number two and number-three markets of China and Japan: We estimate that on this basis the industry grew by +6.8% in 2018 and that it will grow +4.2% in 2019, followed by a year of +4.9% growth in 2020. Such levels represent a faster rate of growth than any other medium, outside of pure-play digital.

    What is behind this trend? First, OOH’s effectiveness is relatively undiminished by fragmentation or ad avoidance. Second, owners of outdoor-related ad inventory have invested in digital infrastructure, including a capacity to better manage inventory and trade the medium programmatically. There is also widening availability of digital out of-home inventory from niche providers. This encourages a wider range of advertisers to use the medium and provides some confidence in the long-term opportunities to reallocate budgets within the medium more efficiently, at least where related real estate is constrained by local laws and regulations. Outdoor is also benefiting because there are many fast-growing marketers who believe the medium is a superior alternative to television when goals are focused around brand building and target audiences are in geographically narrow areas.


  • The Year Ahead for TV


    Published from the GroupM TYNY Report


    Globally, we estimate that television ad revenue declined by -3.6% in 2019, excluding U.S. political advertising (or -5.5% including it).


    Despite the inclusion of digital extensions associated with TV in some markets (including the U.S. and U.K.) and various other advancements, TV is unlikely to grow in the future on an underlying basis, and we expect just under $170 billion in annual ad revenue each year through 2024. New forms of TV—or premium video advertising— will likely lead to a shift in spending within the medium going forward. Although television arguably remains most effective in helping marketers build their brands, the relative effectiveness of television has likely fallen, at least incrementally. And, the share of budgets allocated toward TV have generally diminished incrementally with each passing year. This has occurred as some advertisers shifted some budgets out of TV and into digital, and other advertisers shrank in size and reduced media spending, including TV. Television now commonly represents around 40% of a typical large brand’s media budget, or 27% on average across all advertisers as reflected here for 2020. Interestingly, the median growth rate in 2019 was +0.1% and should be +1.8% in 2020, illustrating that there are many countries where TV advertising is still growing. The median country should see growth of between +1–2% each year through 2024.


    Top of mind for many marketers using television as a key part of their media mix is the impact of new SVOD services, especially the U.S.-based media giants. In a mature market such as the U.S., we can see the impact of the availability of streaming alternatives prior to the launch of Disney+: Cord-cutting and cord-shaving are accelerating to record levels, with total Pay TV subscribers now falling annually by low single digits, and the median network losing mid-single-digit percentages of subscribers on a similar basis.


    Traditional TV viewing across all audiences and all forms is down only slightly, but this masks the growth of streaming-related activity. Concurrently, consumption of television using internet-connected devices accounts for nearly 15% of TV-related activity, and is growing by around +30% year over year. A majority of this internet-connected-device viewing is directed to SVOD services.


    The leading driver of this behaviour is Netflix, of course, with 158 million subscribers in total, including approximately 61 million U.S. subscribers (50% of all U.S. TV households), 12 million in the U.K. (41% of all households there), 10 million in Brazil (close to 20%), six million in France (nearly 25%), and six million in Canada (nearly half). The competitive offering from Amazon’s Prime Video is nearly as widely subscribed, while other services primarily operating in single countries—including Baidu’s iQiyi, Alibaba’s Youku Tudou, and Tencent Video (all in China); Hotstar and Hulu (in India and the U.S., respectively, and both owned by Disney)—have also emerged. In addition, a growing range of specialist and niche services and streaming replacements for traditional TV networks is now widely available. And of course, much more is set to come in the year ahead following the 2019 launch of Disney+ and Apple TV, with pending launches of new services from Comcast/ NBCUniversal’s Peacock and AT&T/WarnerMedia’s HBO Max.


    For these new SVOD services to have a meaningful impact in the U.S. or elsewhere, meaningful investments will still be required—and the media owners making those investments will face hard financial choices. Some of the new SVOD services are launched by traditional TV owners, and accelerating investment in SVOD content will partially depend on overcoming the friction tied to cannibalising existing revenue streams. These are hard decisions. Taking risks and making investments will help futureproof their businesses, but not every company will do all they need to in the short term in order to ensure long-term health.

    Consider the scale of investment required to be competitive:

    • In the U.S. alone, Netflix is on track to spend around $3.5 billion this year on an accrual basis, or probably closer to $5 billion in cash terms (assuming one-third of the global $15 billion in expected spending this year is attributable to the U.S.). This amounts to around 5% of the ~$75–80 billion spent by all MVPDs and streaming services in the U.S. This spending is arguably reasonable, considering how much viewing Netflix generates: The company accounts for 37% of all streaming consumption on televisions in the U.S., and streaming accounts for around 14% of TV consumption, according to Nielsen data. From this data we can calculate that Netflix has a 5% share of viewing, roughly the same as their percentage of spending on content. Over the next several years, costs will undoubtedly rise as Netflix looks to maintain its audience share, and so it is not unreasonable to think in terms of $5 billion in spending on an accrual basis (or more than $6 billion on a cash basis) by 2024.


    • Disney expects to spend $5 billion annually on content for Disney+ by 2024, with one-third of subscribers inside the U.S., and presumably a proportional amount of spending on content assigned to their U.S. content expenses. This will be paired with spending on Hulu, which last year amounted to around $2.5 billion, and which will presumably rise significantly. Even backing out costs associated with Hulu’s vMVPD service, we could expect a $4+ billion streaming content bill for Disney’s domestic operations in 2024.
    • Similarly, AT&T has indicated that by 2024 it will be spending an incremental $3 billion on domestic programming for its HBO Max service, above and beyond what it already spends on HBO today.
    • According to the Financial Times, Apple has committed $6 billion to spending on original shows and movies for its TV service, presumably globally, over an unclear time horizon.

    If each of these services aims for viewing parity, it is not hard to imagine their spending $4 billion per year, on average. Additional services will also undoubtedly be significant buyers of content, including Comcast’s Peacock and ViacomCBS, which will presumably invest more heavily in their initiatives as the two companies formally come together. The total amount of annual spending in the U.S. alone would likely amount to around $30 billion if all of this plays out.

    All of this new spending would be consistent with recent increases in industry-wide programming costs. If the non-streaming world were able to hold the line on its content spending at around $70 billion, the $30 billion referenced above would represent an incremental $20 billion on spending (as streaming services currently spend around $10 billion on content annually). Over the next five years, this would equate to a roughly +5% increase in annual spending on programming by the services consumers receive in the U.S., a lower figure than the +7% increase in spending on programming we saw from cable and satellite operators over the past five years between 2013 and 2018.

    However, the economics of streaming services are very different than those of the traditional MVPD business. They are less favorable on a stand-alone basis and usually need to be considered in the context of other services with which they are bundled. Assuming that advertising attributable to streaming services will not be incremental to the industry, direct revenues probably won’t fully offset costs by much, if at all, leading to margin erosion.

    There will only be so much money to go around for subscription fees. If consumers continue to increase their spending on all forms of video (which amounted to $140 billion last year for video services, cinema and DVDs) at historical rates through 2024, there will only be an incremental $20 billion in consumer spending available for new services. This is roughly equal to the amount of new spending on content that we estimate above. And, unfortunately, advertising is not likely to be incremental for the industry (as there is only a limited relationship between changes in supply or improvements in targeting and changes in total spending in the advertising industry, unless new advertiser segments are brought into the medium).  This suggests that financial contributions from these new services will not be net positive anytime soon.

    Favourably for Disney, Comcast, AT&T and Netflix, at least, what money is available will mostly go to these companies, as Amazon and Apple appear to primarily look at streaming services as a value-added product and are not likely to attempt to recoup all of their costs directly. The overall economics of these services can be viewed more favorably if we consider their contribution to other business, including reduced churn or pricing premia for services with which they are bundled.

    For the media industry, the question is what media owners’ tolerance for margin erosion will be. This will drive the pace of change in the years ahead. Some owners of streaming services will be more tolerant than others and position themselves more favourably for the future. But it’s also possible that every one of them agrees that this kind of business reinvention ultimately leads to better business in the long run. For consumers, this world arguably looks quite favorable as it offers up better-quality content with the opportunity to purchase content packages more granularly, as needed, even if costs per hour of content purchased rises. For advertisers, some elements of television will worsen because ad inventory is likely scarcer, and reach is likely harder to come by. On the other hand, where advertising does exist in this new world—and many streaming services will embrace advertising as an element of their financial models—it will likely reach more engaged consumers, in potentially more valuable environments than those that have come before.

    Toward these ends, many advertisers want to prepare for such an eventuality. For those who believe it is prudent to make such plans, what should advertisers do? It bears repeating that ad-supported TV in its broadest definition—including streaming equivalents—remains strong in absolute terms and generally maintains superior reach relative to alternatives for most audiences. Of course, there are significant challenges to be overcome in managing campaigns optimised for reach and frequency, given the manner in which those campaigns must be run across different sellers of advertising and different devices, and given the limitations of existing measurement systems.

    If ad-supported TV declines relative to alternatives, different approaches to media planning may be considered. Beyond premium video, many advertisers may run video across environments that include other digital content or on digital out-of-home in an effort to sustain broad reach, albeit without the borrowing of content’s brand equity. Another alternative includes optimizing reach across a wider range of media, with a focus on using each medium to drive awareness as best as each can. Other marketers might find that a focus on outcomes as opposed to proxies for long-term outcomes (which brand awareness is arguably best at) rather than reach is a preferred approach.

    A future with less premium video advertising should present an opportunity to take a fresh look at how marketing is budgeted. If the insights and ideas supporting brands will be more impactful than any individual media execution, processes should focus more on investing in those insights and ideas. Investing in a broader notion of a consumer’s potential life cycle with a brand—ranging from brand ideas to media exposures, brand experiences and word of mouth (including all of the data and marketing technologies that support them)—will probably be impactful as well.

    We are mindful that U.S. trends may occur in other countries, but probably not everywhere—at least not in the same ways over similar periods of time. We see cord-cutting in some other countries, like Brazil, where we see mid- to high-single-digit annual declines in pay-TV subscribers. However, in many other places, the concept of cord-cutting is not meaningful yet, especially in countries where digital terrestrial TV makes it possible for consumers to access what Americans might think of as “basic cable” with a simple antenna, or through a free set-top box provided by an internet service provider. Viewing trends will also be impacted by the fact that pay-TV penetration has often been low to begin with in many countries. This would limit the hours consumers have historically spent with TV, at least relative to the U.S. Where that has been true, it is possible that the wider availability of SVOD services (and the premium content they offer) could lead to an expansion in viewing of the medium in its broader definition. More viewing, especially of high-quality TV content, should lead to more engaged viewers—all things being equal—and should prove to be positive for advertisers.


    TOMORROW: THE YEAR AHEAD FOR THE INTERNET


  • AdEx to grow 12.6% in 2020: GroupM


    By A Correspondent


    Adspends in India will grow 12.6% in the year 2020, a slight increase from the 12.4% in the year 2019. This was part of the global ‘This Year Next Year’ report released by GroupM at a global level. It may be noted that GroupM presents its India-specific numbers every year in early February, which can hence be expected two months from now.


    According to the numbers released, for India, the growth in television will be 11.1%, whereas for radio it will be 8%. The growth forecast numbers for newspapers and magazines are 1% and -10% respectively. While the growth for outdoor and cinema is pegged at 8.1%, that for internet will be 26.3%.


    Prasanth Kumar

    Said Prasanth Kumar, CEO, GroupM South Asia: In 2020, India faces challenges and uncertainties across sectors, just like other markets. However, this also brings opportunities for brands to innovate. This will be propelled by greater use of technology and better content across media.”


    Meanwhile, here’s the rest of the report:


    The global economy has weakened in 2019 and will remain similarly soft in 2020. By our calculations, based on Refinitiv data, the gross domestic product (GDP) of the countries we track in “This Year, Next Year” is growing by only +2.6% this year in real (inflation-adjusted) terms.


    Growth in 2020 is expected to be similar (+2.5%), with only slightly faster growth (+2.8%) in 2021 and beyond. For reference, +2.5% would be the slowest pace of growth in any non-recession / non-recovery year over the past two decades. In nominal terms (including inflation), 2019 growth for these countries is expected to be +4.9%, down from growth of +5.8% in 2018 and +5.7% in 2017. 2020 looks somewhat similar to 2019, and marginal improvements follow in subsequent years.


    Nominal growth rates are important to track because they are the most directly comparable figures to those with which marketers and media owners work in determining their own financial plans.


    Personal consumption expenditures are holding up better. One factor that has probably helped sustain marketing growth so far this year is growth in personal consumption expenditures (PCE). As consumer spending represents more than half of all economic activity, PCE can be more important to monitor than GDP. Global growth in nominal PCE is holding up as well in 2019 as it did in 2018 at +5.5% in both years. Growth is expected to slow, but only modestly in the years ahead. Of course, changes in inflation levels diminish these figures, with expectations for real (inflation-adjusted) PCE growth at incrementally slower levels each year over the next five years.


    Industrial production often correlates more tightly with advertising growth trends. Industrial production (IP) figures are another key set of metrics to monitor, as IP often correlates better with advertising activity than either GDP or PCE (manufacturers generally only make things for sale if they are planning to spend money on advertising them). Weighted against GDP in the markets captured here, we see pronounced weakness in 2019 and 2020 (+1.2% and +1.5%, respectively) relative to 2017 and 2018 levels (+3.5% and +3.1%, respectively). Recovery toward slightly higher levels is anticipated for 2021 and beyond.

    Trade and other factors are key sources of uncertainty. As the Organisation for Economic Co-operation and Development (OECD) has pointed out, slowing global trade is clearly dragging on economic activity, and seemingly heightened geopolitical uncertainties are similarly unhelpful. All of this would worsen if the U.S. experienced a recession, although the U.S. economy has remained resilient, likely aided in part by low interest rates and corporate tax reductions, alongside a federal deficit of nearly $1 trillion during the most recent fiscal year. This was equivalent to more than a quarter of all government expenditures and nearly 5% of the overall economy, or more than double its recent trough in 2015.


    Mean and median growth rates may tell different stories. We note the difference between mean and median growth rates, with larger economies expected to perform relatively better than smaller ones in the years ahead.


    Global Advertising Growth Summary


    In this environment, deceleration in advertising growth should be generally unsurprising. Global advertising, excluding U.S. political advertising (large enough to distort global growth rates by +/-1% each year), expanded by +5.7% in constant currency terms during 2018, capping the third year of better than +5% growth and the best year of the current economic cycle. However, 2019 appears set to grow nearly a percentage point slower at +4.8%, and growth is expected to slow by another percentage point in 2020 and 2021. We forecast +3.9% growth next year and +3.1% growth the following year. Growth is expected to range between +3–4% through 2024. Although much worse than recent years, we note that this would amount to a similar pace of growth to what was observed during 2012–2014. We estimate that the total global advertising market during 2020 will amount to $628 billion as we define advertising here, but would likely approach $700 billion on a broader definition that includes spending on direct mail and directories around the world.


    Notably, a substantial share of global advertising is now accounted for by digital-first brands that are endemic to the internet. Based upon their securities filings, we can see that Alibaba, Alphabet, Amazon, Booking.com, eBay, Facebook, IAC, JD.com, Netflix and Uber are each now $1 billion+ advertisers, accounting for $36 billion in spending during 2018, up by a quarter over 2017 levels; growth in 2019 was presumably very similar. Adding a couple dozen companies from the next tier of comparable marketers would easily add tens of billions of dollars of additional activity. Combined, this small group of companies accounts for a majority of the world’s growth in spending on advertising. To the extent that these companies tend to take shares of consumer spending from others and do not directly cause the global economy to expand, at some point their growth converges with global averages, resulting in slowing growth in spending as well.


    The median growth rate has exhibited sharper deceleration in 2019 than the mean. For the countries we have tracked with consistent data back to 1999, the median growth rate in 2018 was +5.2%. It is expected that 2019 will be +2.1%, followed by +2.7% growth in 2020, with generally slower growth than the weighted average. The difference between the mean and median highlights that growth is driven by a small number of large countries and that the typical small country is experiencing worse growth trends, bringing down the worldwide average. By contrast, median country growth was typically well above the mean as recently as 2013, reflecting a period where much of global advertising growth was driven by smaller countries. This maps to the aforementioned global economic trends.


    The U.S. remains the largest global advertising market, with $246 billion in advertising as we define it here, and growing above global averages. With nearly 40% of the world’s total and a still-robust advertising market in 2020 and beyond (at +4–5% growth excluding directories, direct mail and political advertising), the U.S. is helping raise global averages. Our forecasts anticipate a slowing economy as well as the gradual maturation of the digital brands that have driven so much recent growth. On the basis described here, normalized U.S. advertising should slow from +7.6% in 2019 to +5.0% in 2020, +3.4% in 2021, and similar levels in subsequent years.


    China’s $90 billion media market is maturing and beginning to slow, but is still more than two times the size of the number-three market, Japan. After many years of rapid growth, China is now solidly the world’s clear number-two market for advertising, with 16% of total media-owner ad revenue, nearly matching the country’s 17% share of global GDP. However, macroeconomic concerns—including issues referenced above and a general maturation of the Chinese advertising market—are weighing on growth


    this year and beyond. We forecast growth of only +3.7% in 2019 and +1.4% in 2020. Similarly, low levels of growth are anticipated in subsequent years despite faster levels of economic expansion for the overall Chinese economy. Japan remains a solid number three, with 7% of global advertising ($41 billion in 2020) and 6% of GDP, but growth is expected to be tepid there as well; +1.7% growth in 2019 is expected to be followed by +1.8% in 2020, and closer to +1% in subsequent years.


    The U.K. is still growing at a remarkably fast pace. Among larger advertising economies, the U.K. and the U.S. stand out for their healthy growth expectations. For the U.K., it is a feat made more remarkable given how much uncertainty has persisted over the past three years since the Brexit referendum. Five years ago, the U.K. was essentially tied with Germany as the number-four market for global advertising, but since that time the U.K. has grown by +44% while Germany has only expanded by 7%. The factors driving the U.K. are likely similar to those that have helped make the U.S. a strong market, including a substantial presence of digital brand spending as well as the expanding availability of ad inventory (in digital environments, primarily), which help make it possible for smaller marketers to use media. Although we do expect growth to taper off from the high-single-digit levels we have observed since 2014, solid mid-singles (+6.7% in 2020 and +5.5% in subsequent years) are now expected.


    Germany and France are growing at below-global average rates; so is much of the rest of Europe. Brazil should be above average, while India is the world leader among larger media markets. Germany and France have certainly underperformed U.K. and U.S. levels of advertising growth in recent years, but remain in the number-five and number-six positions for now. France appears set to grow at a slightly faster pace than Germany, with a +2.8% five-year compound annual growth rate (CAGR) through 2024 for France versus a +1.6% CAGR for Germany. By 2024, Germany should still be the fifth-largest advertising market, but France will likely be overtaken in importance by both India and Brazil, currently number six and number seven, respectively. Brazil should grow at a solid +4–5% level through 2024 after a soft 2019 (we believe the ad market there grew by only +3.3% in 2019), but India should continue to be stellar, maintaining double-digit growth rates (we estimate +12–13% each year from 2020 to 2024, similar to 2019 levels). Of course, inflation is an issue for both of these countries, negating much of Brazil’s growth. However, in India the effect will only mean that real growth is in high-single digits rather than low doubles.


    Canada and Australia are similarly sized markets, but they are growing in different directions. Canada and Australia round out the world’s $10 billion+ ad markets in 2019, with Canada expected to grow slightly faster over the next five years and growth likely largely tied to the health of its southern neighbor. Australia’s trends will likely differ, as we see at the present time with that country’s economy soft and facing a real risk of recession for the first time in decades. The Australian ad market was likely only stable in 2019 versus 2018 and probably grows only slightly in 2020, for a +2.0% gain expected next year. By contrast, Canada is expected to grow +5.0% in 2019, and should slow toward a high 3%+ growth level next year and in subsequent years. Overall around the world, 14 territories are expected to decline during 2019, with Italy the largest among them: We anticipate Italy will fall by -0.4%. Other large markets among this group include Mexico and Switzerland, which are expected to decline by -4.6% and -8.0%, respectively. Next year, fewer markets are expected to decline, with Switzerland the most significant among them


  • US adspends to grow 4% in 2020: GroupM


    It’s still a few days before the first of the India forecasts are released by IPG Mediabrands and Publicis Media. And perhaps some India numbers from GroupM. But here’s GroupM’s review of 2019 and the forecast for 2020. Shape of things to come?


    U.S. advertising will grow +6.2% in 2019 to $244 billion. This will mark a fourth consecutive year of solid mid-single-digit growth for the industry on an underlying basis. Taking out directories and direct mail makes the health of the industry look even stronger, with a +7.6% underlying growth rate for 2019, although including political advertising in all years brings growth down a few notches to +3.8% all in. However we look at it, growth has been robust relative to the general economy, which is generally decelerating on an underlying basis.

    2020 still looks solid; we are forecasting +4.0% growth next year. We expect some softening next year as the economy reverts toward normalcy after a period of growth likely supported by factors including the 2017 domestic tax cut, an expanding federal deficit and low interest rates. As the effects of these fade, heightened trade barriers should concurrently become a drag on the overall economy. The 2020 Olympics also likely provide some marginal benefits, although we note that it can be difficult to identify the degree to which Olympic activity captures spending that would already have occurred or if it causes incremental spending to flow into the advertising market.

    In more tangible terms, the key variables driving our model are personal consumption expenditures (PCE) and industrial production (IP), which combined have a solid 0.8 R2 correlation with normalised (excluding political) advertising. PCE will likely decelerate versus 2019 levels, while IP might go slightly negative. Using these inputs without adjustment would yield a zero-growth domestic advertising market next year, although it would be hard to imagine a three to four percent nominal GDP/PCE growth economy not producing a similar rate of growth in advertising. Further, we know that a range of factors implicitly not contemplated by our model are holding up advertising growth.


    Digital-first marketers are likely driving much of the industry’s recent growth. We have previously written about the emergence of massively scaled digital brand owners whose businesses are endemic to the internet. We can point to Facebook, Amazon, Netflix,Alphabet, eBay, IAC, Uber and Booking.com as eight companies that are likely to spend more than $30 billion on advertising globally this year. Most of this spending will go into their home market, the U.S., adding billions of incremental spending every year into the domestic advertising economy. If we add in the next tier of digital endemics that may not have existed even a decade ago at anything like their current scale—think Wayfair, Chewy.com or any of the dozens of other digitally oriented companies spending hundreds of millions of dollars on advertising annually at this point in time—it’s not hard to imagine additional percentage points of growth emerging from these types of marketers.

    Such rapid growth from these marketers as we have seen in recent years should abate, and eventually they should normalise their growth rates. This would contribute to industry-wide ad spend deceleration. However, the U.S. is more likely to produce more of these kinds of marketers in years ahead than are most other economies, and so there is some reason for a degree of optimism around these figures. For example, we expect the new and existing streaming video services to account for multiple billions of dollars in domestic advertising spending by the time these services are all operating at scale.

    Overall, our best “feel” for the advertising market is to forecast a lower growth rate beyond 2021, and we incorporate a +3.0% expectation for subsequent years.

    Advertising revenue to pure-play internet-based companies should grow by double digits next year to reach $127 billion in revenue, representing a 50% share of industry revenue. We forecast digital pure-play media (i.e., excluding digital revenues associated with traditional media owners) will end 2019 with a +20% increase. Growth is still expected to be resilient next year, rising by +13% in our forecast and accounting for 50% of all media we track here. There is undoubtedly still room to grow. We can certainly point to other developed economies that currently see digital advertising accounting for higher shares of industry-wide spending, but we think the aforementioned digital endemic marketers will increasingly replace traditional companies that came before them. As those marketers necessarily skew their spending toward digital advertising, spending shares shift in the aggregate toward digital media.

    TV advertising is soft as we close 2019 and will end the year with a -7.0% decline (-2.0% excl. political), falling to $65 billion in ad revenue. Of course, many of the digital-first brands we’ve been discussing will also spend on traditional media, especially television. While defining a “digital brand” is highly subjective, those marketers are undoubtedly making up for most of the cuts in spending that other marketers appear to be making. Excluding political, underlying television advertising is trending toward a low-single-digit reduction during 2019. National TV advertising will be closer to zero, or even up very slightly, while local is down by low-single-digits. We expect this declining trend to persist, even with new forms of premium TV advertising regularly emerging. Certainly the ad-supported SVOD services will be attractive environments and their enhanced targeting capabilities will also appeal to advertisers. They will partially offset the ongoing erosion of traditional TV’s reach and frequency, but the core set of advertisers that have historically driven TV spending are likely to reduce the budgets they allocate to the medium.

    Outdoor should be the fastest growing “traditional” medium, up by +8.0% to reach $8.3 billion. Among other media, outdoor remains a standout for its capacity to sustain growth. This is supported by ongoing innovation, especially in digital out-of-home and OOH’s relatively unique capacity to generate, capture and sustain attention. These advantages are more apparent to many marketers as traditional television continues to weaken. Digital formats are increasingly important, now accounting for half of spending on OOH, with further share gains still to come especially as more automation takes root, including the emergence of performance-based targeting and data-driven trading. At a category level, digital brands and luxury marketers have provided the industry’s recent boost, and much of this has been concentrated in the largest urban markets. These factors have enabled the medium to grow by +8.0% this year, a level that is not likely to be sustained. We expect more modest +4.0 to +5.0% growth levels over each of the next five years. Notably, this represents a gradual increase in the share of spending in the overall advertising economy, which presently amounts to 3.4%.

    Radio is likely to be flat going forward. Radio appears set to hold on to its revenue base this year and is not likely to grow by much any time soon. While there is growing interest in the medium from national advertisers—especially supported by the likes of Pandora and Spotify as well as the emerging category of podcasting—the traditional base of geographically constrained advertisers that should be optimally positioned to support locally oriented media like radio has weakened over time.

    Print will continue to be weak, although it retains value as a niche medium. Unsurprisingly and despite improvements in measurement and its capacity to engage deeply with consumers, overall, the medium is still set to decline on an ongoing basis. Double-digit declines are likely to persist for newspapers and magazines, even including digital extensions. Directories will likely look worse, with -20% or greater declines going forward. By declining in only low single digits, direct mail looks somewhat more positive.

    U.S. political fundraising is approaching $16–20 billion for 2020; political advertising is expected to be $10 billion or more. So far, our forecasts have excluded politics from media spending because the scale of such activity meaningfully distorts year-over-year growth trends. Disclosures from the Federal Election Commission (FEC) covering the first half of 2019 indicate that total federal election fundraising was approximately $2 billion, up around +45% versus 2018 levels and +46% versus 2016 levels. During the prior two-year cycle, the first half-year accounted for only 15% of fundraising, and during the two-year cycle before that, the first half accounted for 16%. This indicates that fundraising through the end of 2020 will exceed $10 billion and could approach $12 billion for federal races, of which somewhere between 60–70% ($7–8 billion) would likely be disbursed during 2020. Local, nonfederal races are tracked separately and via different sources, but data from FollowTheMoney.org indicates that in 2018, there was a total of $8.7 billion in fundraising during that calendar year alone. Assuming that number rises next year, we could expect $16–20 billion in total political spending on all activities in the U.S. in 2020.

    How much of this will turn into media spending? Our understanding is that in a typical campaign, 60% of funds raised may be deployed into media spending, which would translate into $9.6–12 billion in total activity during 2020, which places our $9.8 billion estimate on the low end of this range. Consequently, we recognise that the current political cycle could lead to higher levels of spending than we currently incorporate into our forecast. As our estimates currently stand, and including political advertising in all years, we forecast 2020 advertising growth of +7.1% on a broadly defined basis (including directories and direct mail) or +8.1% on a narrowly defined basis (excluding directories and direct mail).

    Media is a means to an end; the marketer’s goal should be to optimise the mix of external and internal resources available to drive business growth. Putting all of this into some context, we are mindful that marketers can look at the data included here to gain a sense of the health of their media partners now and over the next several years. However, even a media owner in decline may still be investing in new and better ways to connect with audiences. At the same time, other media owners may be healthy in terms of revenue growth but may be neglecting to invest in everything they can to make their ad inventory more effective. As marketers continue to view media as a means to an end, investments in internal marketing infrastructure, marketing technology software and external services are among the other ways to support marketing excellence. We encourage marketers to put processes in place to optimise the balance between all of these elements. This will ultimately be more impactful than the choice to invest or stay away from any one type of media as it grows or declines in the years ahead.

  • Sizing Global Marketing: Expanding Opportunities and Outcomes

    Source: GroupM analysis


    By Brian Wieser


    Media should be viewed as a subset of marketing. Within the media industry, paid media is often studied in isolation from the broader marketing discipline it is a part of. Contextualizing media’s relative size and trajectory is a useful way towards better understanding its role. Unfortunately, doing so in numerical terms can be challenging because there are a myriad of ways that companies can market their products, and a similarly wide range of ways that companies can account for those efforts.  For example, a manufacturer might consider a pop-up store to a marketing expense, as might a service provider who is developing a new product enhancement. They are not wrong to think in these terms.


    Estimating the size and trajectory of the marketing industry is tricky. Rather than building “bottoms-up” supplier-based estimates of marketing spending (which would fail to capture spending incurred by marketers through their in-house labor and other costs) we have approached this problem by looking to see how much companies claim they spend on marketing relative to advertising. To the extent the companies we have included in our study are representative of the broader industry, with some confidence in our total advertising spending figure we can have some confidence in our marketing spending figure.


    More specifically, we looked at companies who:
    • Are either among Ad Age’s largest 100 global marketers or the largest 200 in the US
    • Spend more than $0.5 billion on marketing annually
    • Are publicly listed
    • Disclose either a marketing-related or advertising expense and
    • Provide internally consistent data for at least five years.


    In total, we looked at 78 companies with a combined total of $5.2 trillion in most-recent fiscal year annual revenues.  Among these companies, 16 provided both a marketing-related expense and an explicit advertising related expense (which we will refer to here as Group 1).  In total, 35 disclosed a marketing expense item (and this grouping of companies will be referred to here as Group 2) while 59 disclosed an advertising expense item (this grouping will be referred to as Group 3).


    Total marketing = around 2.5x of total advertising.  What we saw was clear:
    • On a weighted average basis, Group 1’s marketing budget amounted to a relatively consistent 2.5x of advertising budgets (2.6x in 2014, but 2.5x in all other periods)
    • Looking at the median company in Group 1 (to isolate whether individual large companies skewed the above results) we see more volatility with a range from 2.1x to 2.7x, but a generally similar ~2.5x range (and no clear trend over time, other than a slight dip in 2017 and a spike in 2018)
    • Looking at the much wider field of companies (Group 2), the ratio of spending by all companies disclosing marketing expenses was between 2.4x to 2.6x the share of revenues allocated to advertising by all companies disclosing that figure. As with the Group 1 median, we saw a slight dip in 2017 and a spike in 2018

    Bar Graph of the mean and median of advertising and marketing of 78 companies from 2014 to 2108
    Source: GroupM analysis of company reports; Refinitiv


    The “dip and spike” between 2017 and 2018 on two of the three measures we show here could mean that advertising grew faster than marketing in 2017 and then grew slower than marketing in 2018.   However, the growth trend is not overwhelmingly conclusive, and so additional years of data will be necessary to assert that media is either growing faster or slower than the rest of marketing.


    We can infer that spending on marketing amounts to around $1.6-1.9 trillion annually around the world.  More broadly, the relative stability of the range provides some confidence about the size of marketing spending. Assuming the ratio of marketing to advertising holds up across the global economy, and assuming advertising accounts for $650-700 billion (depending on definitions of the industry used), we can say with some confidence that marketing accounts for somewhere between $1.6 trillion to $1.9 trillion globally.


    Source: GroupM analysis


    As we have a good sense of spending on marketing related services (agencies and IT services consultancies focused on marketing) as well as software (marketing tech and ad tech) we can then estimate that spending on other forms of marketing amounts to a range of between $0.6-0.9 trillion per year. A total around this size is not overly surprising.  What might be slightly surprising is that there was no clear trend in terms of the multiple rising or falling by much. This indicates that marketing is not necessarily growing much faster or slower than is media; conversely, it indicates that media is not necessarily growing faster than the rest of marketing is, despite the perceived advantages of an industry that is increasingly digital and performance-oriented.


    Suppliers of media, products and services should look at their relative effectiveness in context of all marketing activities. Putting the wonkery of developing these sizing estimates aside, there are some important take-aways for the broader marketing industry. First, it is important to note that the total addressable market we estimate here represents the volume of resources made available to drive business growth through marketing.  Second, individual sub-sectors within marketing (media owners, service providers, software companies and other external entities) should look at the potential for their own commercial activities through the lens of the size of the total marketing industry rather than the category they generally operate in.


    For opportunities to expand for industry participants, marketers will need to improve the degree of flexibility they have in allocating the resources they require to support long-term business growth.  At the same time, sellers of media, services and products need to continually improve the ways in which they identify how their offerings contribute to favorable business outcomes relative to other forms of marketing spending.  Doing so will help to persuade marketers to become more flexible in managing total spending and related processes more holistically across the widest possible range of marketing activities.


    Brian Wieser is Global President, Business Intelligence GroupM. This article was first published at https://www.groupm.com/news/sizing-global-marketing-expanding-opportunities-and-outcomes


  • Motivator wins healthcare mandate of Soothe

    By A Correspondent


    GroupM agency Motivator has won the media mandate for Soothe Healthcare, makers of Paree and Pariz sanitary pads. The account will be handled by its Gurugram office.


    Said Mausumi Kar, Managing Director, Motivator on the win: “We are excited to partner with Paree. It is a brand that is creating waves with a compelling, first of it’s kind of need solution in a category that’s very competitive. Our essence is one of ‘questioning status quo to arrive at differential routes to success’ which matches perfectly with Paree’s vision of redefining the category. We look forward to our journey together.”


    Added Sahil Dharia, Founder & MD, Soothe Healthcare: “Innovation is one our core values and our unique product proposition of ‘Heavy Flow- 3 Second absorption’ is complemented by a communications and media strategy that fits well together.  Paree is India’s first professionally managed feminine hygiene brand to reach scale with a progressive brand story to tell. We look forward to working with Motivator to push the envelope on bringing this category out of the closet”.