Tag: Zenith

  • Zenith wins global media business for Lactalis

    By A Correspondent


    Zenith has won the global pitch for the consolidated media business of dairy products corporation Lactalis. Zenith has been appointed as the agency partner, commanding 75 per cent of Lactalis’ markets. The win sees Zenith retain all its existing markets in EMEA, APAC and Lat Am and take on 11 new ones, including Canada, UK and USA.


    As its agency partner, Zenith will have lead media communications responsibility, with global coordination run from Zenith’s HQ in London. Zenith will now work with Lactalis both centrally and locally to deliver against the company’s growth targets.


    Said Vittorio Bonori, Global Brand President, Zenith: “We are absolutely delighted to become Lactalis’ Master Agency Partner. This is a testament to our strong relationship with Lactalis and to Zenith’s approach to driving business growth as the ROI agency.”


  • Achche Din…! Zenith forecasts 15% AdEx growth in 2019


    By A Correspondent [to be updated by 9.30am]

    Media agency network Zenith forecasts that adspends for India in year 2018 will close at Rs 62,699 crore. And the total AdEx for India will see an increase of 15% and climb up to Rs 72,169 crore in 2019.

    India remains one of the fastest growing economies, with strong GDP growth of over 7%, led by reforms in sectors such as retail, infrastructure, manufacturing and services, notes a Zenith communique, adding: “Given that a significant part of the population is below 30 years of age, there is likely to be continued consumption-led growth with less reliance on export-led momentum.  This should give a boost to businesses across the board, ad investments and government initiatives.”


    Furthermore, the release adds: “However, 2018 has also seen the depreciation of the rupee and oil price volatility. The overall expectation is that oil prices will stabilise, giving Indian consumers more disposable income. Indian consumer confidence continues to remain relatively high. “

    According to Tanmay Mohanty, Group CEO at Zenith, many parts of India were experiencing digital transformation, led by mobile. This will accelerate categories such as banking, financial services, healthcare, entertainment and sports, travel and lifestyle. “2019 is the year of the Indian General Elections. These and the State Elections will boost marketing spends.  Additionally, the Cricket World Cup and the Indian Premier League will drive growth.” Mohanty said.

    “Digital will continue to accelerate both in reach and consumption.  Television – linear and catch-up will be on an upward curve. The expectation for radio is that it will digitise aggressively in response to streaming services while both cinema and out of home (OOH) will innovate and increase reach-led investments. Print will thrive on regionalisation.” Mohanty added.

    According to a similar report released last year (Dec 4, 2017), total AdEx for India was estimated to climb up to Rs 58,422 crore, growing  at 8.4% in 2018, led by television. This estimated has been bettered by the figure of Rs 62,699 crore as quoted earlier for adspends in 2018.

    Meanwhile, online video and paid search are driving the growth in global adspend, as advertisers focus on personalised and targeted communications, according to Zenith’s Advertising Expenditure Forecasts, published today (December 3).

    This is what the rest of the summary, as provided to the media, notes:

    With advertisers now able to use these channels to target with pinpoint accuracy and serve personalised messages, they are increasing both the efficiency and effectiveness of campaigns. Between 2018 and 2021, online video advertising will grow at an average of 18% a year, twice as fast as other forms of internet display advertising and well ahead of any other channel.

    Paid search is not growing as quickly in percentage terms – it will grow at an average of 7% a year over this period – but in dollar terms will contribute even more to global growth than online video. The application of AI techniques, better location targeting, integration with commerce and the rise of ‘in the moment’ search are all making search more effective for advertisers. We forecast that between 2018 and 2021, online video advertising will grow by US$20bn, while paid search will grow by US$22bn. Between them these two channels will account for 60% of the extra ad dollars added to the market over this time.

    Online video and television are more important to brand-building than ever

    Advertisers commonly use online video together with traditional television, combining television’s broad reach and immersive experience with online video’s ability to target and optimise frequency. Taken together, these two media are becoming more important to advertisers’ brand-building campaigns. Their combined share of adspend in ‘display’ media (i.e. all media except paid search and classified advertising) has risen from 46.2% in 2012 to 48.4% this year. By 2021 we expect television and video to have a combined 48.8% share of global ‘display’ – a higher share than television ever achieved on its own. Taken together, television and online video are working harder for advertisers than ever before.

    Global e-commerce advertising starts to accelerate

    E-commerce advertising – advertising that sits alongside and within search results and product listings on e-commerce sites – is well established in China, but is only just starting to get going globally. Zenith believes it has the potential to transform the way brands convert customers online, and add about US$100bn of new money into the global advertising market.

    E-commerce advertising has risen from 0.8% of all adspend in China in 2009 to an estimated 18.2% this year, driven by investment by companies like Alibaba in turning e-commerce into advertising revenue. Until recently, e-commerce platforms outside China have largely focused on direct sales to consumers at the expense of advertising, but that is now changing. Amazon generated nearly US$5bn in advertising revenue in 2017 as a whole, and in Q3 2018 its ad revenues grew by 122% year on year. Other shopping platforms are following suit by investing in their own advertising activities.

    Globally, e-commerce advertising is about as advanced as it was in China at the end of the last decade. Amazon accounted for 0.8% of global adspend in 2017, the same proportion that Chinese e-commerce occupied in 2009. If e-commerce follows a similar path globally to the one it followed in China, it could account for 18% of global adspend by 2027. That’s equivalent to over US$100bn in today’s ad market, representing a huge revenue opportunity for the platforms, and a whole new way for brands to reach customers at the point of purchase. This money typically comes from brands’ commercial teams rather than their marketing teams, from budgets set aside for negotiating with retailers. It is therefore new money to advertising, and should expand the market without cannibalising money spent elsewhere.

    Steady growth in global adspend to continue

    We estimate that global advertising expenditure will grow 4.5% by the end of this year, boosted by the Winter Olympics, FIFA World Cup and US mid-term elections. Growth will then remain steady and positive for the rest of our forecast period to 2021, at 4.0% in 2019, 4.2% in 2020 and 4.1% in 2021.

    Central & Eastern Europe will be the fastest-growing region, with average growth of 6.3% a year between 2018 and 2021, driven by continued strength in Russia, which is growing at 6.8% a year and accounts for 39% of the regional total. Asia Pacific is next, growing at an average of 4.9% a year, or 5.7% a year excluding Japan. India is the stand-out growth market here, growing at 13.5% a year from US$9.7bn in 2018 to US$14.2bn in 2021, when it will become the world’s eighth largest advertising market, entering the top ten for the first time. India has huge potential for further growth, with advertising taking up just 0.3% of GDP, less than half the Asia Pacific average of 0.7%

    Young advertising markets like India are playing an ever-more-important role in driving global growth in adspend. ‘Mature’ markets – by which we mean North America, Western Europe and Japan – account for 62% of global adspend this year, down from 75% ten years ago. ‘Rising’ markets – by which we mean all markets apart from the ‘Mature’ ones – will contribute 54% of the growth in global adspend between 2018 and 2021, increasing their share of global expenditure from 38% to 40%.

    “E-commerce advertising is poised to transform the advertising market in much the same way that paid search did in the last decade,” said Jonathan Barnard, Zenith’s Head of Forecasting and Director of Global Intelligence. “It could bring US$100bn in new money into the market over the next ten years.”

    “Brands are transforming their businesses to take advantages of the new digital opportunities available to them,” said Vittorio Bonori, Zenith’s Global Brand President. “Better segmentation and targeting, personalised creative and direct transactional relationship with consumers are combining to drive brand growth.”


  • Digital will rule UK adspends


    By A Correspondent


    It’s a still a few days before the Zenith, IPG Mediabrands and GroupM forecasts for global adspends is released, but we thought it would be good to carry GroupM’s forecast for 2019 for the United Kingdom (UK), as it could offer some indicators for the shape of things to come for India. Only the Zenith and Mediabrands reports carry detailed numbers for India. The GroupM report for India as well as the Madison forecasts are typically released in early February.


    According to GroupM,  UK advertising is expected to increase to £20.8 billion in 2019, surpassing the £20 billion mark for the first time, up from £19.9 billion in 2018.


    GroupM’s forecasted distribution of advertising investment is below:


    GroupM forecasts 6.0% growth for 2018, down from 6.4% in 2017. Its 2019 growth prediction from earlier this year is shaved to 4.8% from 5.1%. A significant contributor to global advertising growth, the UK still looks to remain stable due to the high levels of digital advertising growth. Digital is around 60% of all advertising investment and accounts for all net UK advertising growth. The medium continues to grow organically, predominately from SME investment, with signs that larger advertisers are becoming more circumspect about incremental digital investment.


    Pure-play internet increased 11% in 2018 and is expected to continue growing by 9% in 2019. Slower than IAB’s estimated run-rate of 15% for 1H 2018, GroupM sees an inevitable slowdown, although digital is still likely to account for all new net advertising growth.


    Said Tom George, CEO, GroupM UK: “Collaboration and measurement remain key topics for the UK alongside Brexit and GDPR in our advertising forecast for 2019, but in a sea-of-change advertising investment stays buoyant reaching unprecedented levels. It’s encouraging to see the industry pulling together to create new and improved investment propositions. GroupM is highly engaged with all of these efforts to ensure our clients continue to effectively engage consumers.”


    GroupM forecasts television advertising investment to remain flat in 2018, with 1% growth expected in 2019. According to Nielsen, key TV categories soft this year include Food, Household FMCG, Retail, Entertainment & Leisure. Finance (TV’s largest category) and Motors (fifth) are growing high-single-digit in the year to September. ‘Share deals’ remain the principal trading mode in UK TV, which advertisers value for its tolerance of short-run budget revisions, but mixed modes of airtime are becoming more routine as trading embraces more audience falling outside Barb’s ‘gold standard’. Facebook in particular, is still winning share of audio-visual advertising and is heavily video-biased for large advertisers. The main reason is convenience and the lust for ‘performance media’.


    Print media continue to shrink, with newspapers (national and regional) plus magazines collectively shedding about 1.5 share points a year. In 2017, news brands included 12.5% of all ad investment and in 2018 11.1%, with 2019 estimated to drop to 9.8%. Even with mitigation from digital sales (now a large minority of ad sales), this reveals an investment trend of -6% in 2018 and -7% in 2019, as the ‘walled gardens’ capture more share. Armed with research, owners are putting up a united front with reassurance and stable media pricing; this has renewed advertiser enthusiasm for the medium.


    Radio is holding its audience and enjoying rising demand. GroupM forecasts radio spot advertising revenue to rise 10% in 2018 and 7% in 2019. Radio owners will book about £500 million in spot revenue in 2018. This does not include digital and streaming revenues, which are an unmeasured mix of static and dynamic activity, and thus hard to estimate. The annual run-rate is probably above £100 million.


    “Future Brexit fall-out remains a complete unknown, but for now the economy is doing OK. Ad revenue forecasts remain perhaps surprisingly positive, supported by digital commanding a rising share of overall marketing effort from a wider base of marketers large and small. The UK’s fluid media market favours optimism too. Advertisers know they can change spending plans almost at will, with low or no friction,” said Adam Smith, Futures Director, GroupM.


  • 65% of digital media to be programmatic in 2019


    By A Correspondent


    Sixty-five per cent of all money spent on advertising in digital media in 2019 will be traded programmatically, according to Zenith’s Programmatic Marketing Forecasts, published today. Advertisers will spend US$84bn programmatically next year, up from US$70bn this year, which represents 62% of digital media expenditure. We predict that in 2020 advertisers will spend US$98bn on programmatic advertising, representing 68% of their expenditure on digital media advertising. By digital media we mean all forms of paid-for advertising within online content, including online video and social media, but excluding paid search and classified advertising.


    The breadth of ad formats available through programmatic trading is improving, with more mobile, video and audio formats coming online all the time, though brands and agencies need to do more to push publishers to improve the quality of their inventory, which needs at minimum to be safe and viewable.


    Growth in programmatic advertising is slowing as it cements its position as the most important method of digital trading. We estimate that programmatic adspend will grow 24% in 2018, down from 32% growth in 2017, and forecast 19% growth in 2019, followed by 17% growth in 2020.


    In dollar terms, the biggest programmatic market is the US, where we expect US$40.6bn to be spent programmatically in 2018 – 58% of the total. China is in a distant second place, spending US$7.9bn on programmatic advertising this year, followed by the UK, with US$5.6bn of programmatic adspend.


    The US is also the market that has most embraced programmatic advertising, trading 83% of all digital media programmatically this year. Canada is in second place, trading 82% of digital media programmatically, followed by the UK, with 76%, and Denmark, with 75%. By 2020, programmatic advertising will account for more than 80% of digital media in all four markets. Canada will have almost completed the transition to pure programmatic trading, spending 99% of digital media programmatically that year.


    We expect all markets to follow Canada and use programmatic trading for all digital media transactions eventually. Indeed, it’s only a matter of time before programmatic trading becomes the default method of trading for all media. However, the transition is taking slightly longer than we expected – last year we forecast that 64% of digital media would be programmatic in 2018, and 67% would be programmatic in 2019, so we have pulled back both forecasts by two percentage points. The introduction of privacy legislation such as the EU’s GDPR has had some chilling effect by making certain data previously used in programmatic transactions unavailable, and making other data more costly to process. But we think the main reason for the slowdown in spending on programmatic media is that advertisers are investing more in infrastructure and data to make their programmatic activity more effective.


    To make the most of their programmatic campaigns, advertisers have to reorganise internally to give programmatic trading the high-level support and understanding it needs. Agencies can only extract maximum effectiveness from their programmatic strategy in a proper partnership with their clients. And a programmatic strategy can only ever be as effective as the data used to execute it.


    “Programmatic trading improves efficiency and effectiveness, and is gaining a dominant share of digital media transactions,” said Benoit Cacheux, Zenith’s Global Head of Digital and Innovation. “The scale of operational restructuring to make the most of it is both extensive and expensive, though, and advertisers are spending more carefully while they invest in infrastructure and data and review the quality of media. All programmatic advertisers need a strategy for acquiring the best and most comprehensive data available, and to treat this data as a vital corporate asset.”


    The most valuable data is first-party data, either explicitly provided by consumers or gained by tracking their activity on owned websites. It is also becoming more common to use second-party data, by forming data sharing partnerships, between – for example – brands and online retailers. Third-party data is widely available but does not give advertisers a competitive advantages, since all advertising can use it to target the same segments. Advertisers should continually vet and interrogate third-party data to ensure they are truly adding incremental reach. By combining all this data with their own CRM systems, advertisers can model consumer behaviour, and the more advanced are using machine learning to predict it. Data and new technology is enabling brands to move from tracking cookies to communicating with individuals.


    “Technology is making programmatic advertising work harder for brands,” said Jonathan Barnard, Zenith’s Head of Forecasting and Director of Global Intelligence. “Artificial intelligence promises to unlock new understanding of customers as people, as well as improving the optimisation of the trading process.”


  • Publicis Media agencies named a strong performer by The Forrester Wave

    By A Correspondent


    Publicis Media agencies Zenith and Starcom were named a leader and a strong performer, respectively, in The Forrester Wave: Global Media Agencies, Q3 2018. Both agencies were among the select companies that Forrester invited to participate in this evaluation of the media agency landscape, notes a communique from the media agency holding firm.


    Zenith received the second-highest score in the Strategy and Current Offering categories, and was recognised for its ability to converge commerce and media to drive client growth. The report noted that the agency’s heritage as one of the first independent media networks sets the stage for its vision to master the newly converging media and commerce landscape, and cites its investments in eCommerce, personalization, marketing consulting, automation, AI and data visualisation skills and tools.


    Starcom was named a strong performer, and was noted for its ability to blend operational excellence with digital prowess. According to the report, Starcom’s “reputation as a strong media operations partner has allowed it to catch up its data practice and integrated approach to planning and activation.” The report also cites that “Starcom shows strength in operationalizing its HX process into media strategy, communications planning, buying and activation.”


  • Zenith wins Spykar

    By A Correspondent


    Zenith has won the media duties of India’s leading Jeanswear brand Spykar. The business was won as part of a competitive multi-agency pitch. Said Tanmay Mohanty, Group CEO, Zenith India: “We couldn’t be more thrilled to partner with Spykar which is India’s own home-grown contemporary jeanswear brand and needs no introduction.   Our ROI-focused approach will drive maximum business growth for Spykar, on the back of strong tech, analytics, content and consumer- centric insights. This win is testament to our scale and ability to bring in astute media strategies for powerful, integrated brand campaigns.”


    Added Sanjay Vakharia, CEO, Spykar:  “Spykar has been India’s leading denim brand for 25 years. Great product coupled with widespread distribution has given us exemplary growth. In the last 3 years, our revenues have doubled. This has encouraged us to pursue aggressive growth plans and we were looking for a partner who can help  us in achieving our goals. We have selected Zenith after a comprehensive pitch process. They have dived deeply into our business and impressed us with their vision and proficiency in delivering effective, data-driven, personalised plans.  Lifestyle clothing is a dynamic, high-growth business and we are sure that Zenith’s strategic insights  will unlock new opportunities for us. Their culture of innovation is akin to our own and we look forward to working with them.”


  • Online video viewing in India to leapfrog to 52mins/day in 2018


    By A Correspondent


    Online video viewing will leapfrog to 52mins a day in 2018 from a lowly 39 minutes in 2017, report media agency network Zenith.Global consumers will spend an average of 67 minutes a day watching online video this year, up from 56 minutes last year, according to Zenith’s Online Video Forecasts 2018, published today. By 2020 the average person will be spending 84 minutes a day watching videos online. In that year, China will have the keenest viewers, with the average person spending 105 minutes a day watching online video, followed by Russia (102 minutes) and the UK (101 minutes). This rapid rise in consumption is leading to a shift in the way brands plan campaigns across both television and online video. India-specific numbers are in the table above.


    This is the fourth edition of Zenith’s annual Online Video Forecasts report. It contains historical data and forecasts of online video consumption and advertising, together with commentaries on the development of individual markets by local experts. This year’s edition covers 59 key markets. By online video we mean all video content viewed over an internet connection, including broadcaster-owned platforms such as Hulu, ‘over-the-top’ subscription services like Netflix, video-sharing sites, e.g. YouTube, and videos viewed on social media.


    Global online video consumption grew by 11 minutes a day in 2017, and we expect it to grow by an average of 9 minutes a day each year to 2020. It accounts for almost all the growth in total internet use, and is growing faster than media consumption overall, so it is taking consumption time from traditional media. Although some of this extra viewing is going to non-commercial platforms such as Amazon Prime and Netflix, plenty of it is going to commercial platforms, so the supply of commercial audiences is rising rapidly.


    Zenith estimates that online video adspend grew 20% in 2017, to reach US$27bn. Growth peaked at 36% in 2014 and has fallen steadily since then, but still remains very high. “We forecast 19% growth in 2018, and an average of 17% annual growth to 2020, when online video adspend will reach US$43bn. Video’s share of online display advertising is rising steadily: it accounted for 27% of display adspend in 2017, and we expect it to account for 30% in 2020,” the report notes.


    More from the report:

    The supply of online video audiences has been growing ahead of demand in recent years: online video viewing grew 91% between 2015 and 2017, while adspend grew 52%. The cost of online video advertising has therefore come down substantially. As the growth of video consumption grows we expect prices to stabilise, with mild increases from 2019 onwards.


    Online video advertising is still only a fraction of the size of television advertising, but because television is stuck at 0% to 2% annual growth, this fraction is rising rapidly. The online video ad market was 10% of the size of the television ad market in 2015, and 14% in 2017. By 2020 we expect online video adspend to be 23% of the size of television adspend.


    Online video and television complement each other well, with most brands initially using online video to add incremental reach to their existing television campaigns. But with the rapid growth of online viewing we are now seeing more brands plan television and online video together to optimise frequency.By cutting out television spots that lead to very frequent exposure among heavy television viewers, andusing online video to target – and retarget – light television viewers, brands are using television and online video together to cut out both overexposure and underexposure within the target audience, maximising recall at a reduced price.


    Online video advertising began by emulating television advertising, with most ads appearing within other video content that the viewers were really interested in as interruptive ‘in-stream’ ads. But over the past few years ‘out-stream’ ads have become common. These are stand-alone video ads that appear within text or images, or within a social news feed. Thanks mainly to the rapid adoption of video content and advertising by social media platforms, out-stream video is rapidly becoming the dominant form of online video advertising. In the UK, for example, it overtook in-stream advertising to account for 56% of online video adspend in 2017. This is changing the structure of online video creative. Because a viewer can simply scroll past them, out-stream ads need to grab the viewer’s attention from the very first second, either with an arresting image or with a celebrity with a dedicated following. They do not have the narrative leeway available to interruptive ads.


    “Online video is driving growth in global media consumption, as smartphones with high-speed data connections make high-quality video available to people on the move, and smart TV sets give viewers unparalleled choice in the living room,” said Jonathan Barnard, Zenith’s Head of Forecasting and Director of Global Intelligence. “The rapid rise in video viewing makes online video the world fastest-growing advertising format, creating new strategic and creative opportunities. Brands that do not currently have a strategy for online video need to think about getting one.”


  • Voice & what it means for Marketers


    Republished from Zenith’s ‘Global Intelligence 2018 – The Year Ahead’ report


    Predictions for 2017

    Voice is the next big step in computing, after the transition from desktop to smartphone. Developments in machine learning and natural-language processing have driven the rapid growth of voice search and smart speakers, promising dramatic changes in the way we search, shop and interact with companies. The interface is simple and delivers a single, best answer, instead of the slew of search results we are accustomed to onscreen. These devices also play music, set timers, control other devices about the home, and place shopping orders.


    What happened in 2017?

    Thanks to a sharp fall in prices, smart speakers have become true mass-market devices, with 33.2 million shipped over the past 12 months according to Canalys. Smart speakers are becoming the central control hubs for the smart home. Using them quickly becomes a habit – they are not a short-lived fad.

    Voice shopping is picking up quickly. Amazon’s Alexa adds items to a shopping basket and completes the purchase using just voice commands, and even offered exclusive deals on Black Friday. Still, brands have had trouble redefining themselves for this new reality, after spending years perfecting the arts of designing, packaging and marketing their products visually.


    What’s next?

    According to Gartner, voice search will be the fastest growing mobile search channel in 2018, and com Score predicts 50% of all searches will be made by voice in 2020. Google’s aim is to improve its ‘Answer Box’ to provide the most accurate and best content. The same principle works for Google Home and Alexa, which are focusing on the best products and services to ensure good experiences for consumers. We’ll see intelligent services learn not just to talk to us but to learn to recognise emotion, engage and have meaningful conversations.


    The big tech companies – Google, Amazon, Microsoft and Apple – are fighting to deepen consumer engagement by embedding their assistant platforms across all consumer electronics. Other companies recognise the need to improve time to market through collaboration, partnerships and open platforms. For example, numerous car manufacturers are integrating voice assistants into their 2018 and 2019 models, and Samsung is bringing its voice assistant Bixby to its smart TV sets and Family Hub fridges.


    By the end of 2018, voice will have changed the way devices and applications are designed, and will be on the way to becoming the primary interface by which we engage with technology and the world around us


    What does this mean for marketers?

    As consumers become accustomed to digital assistants, they will start to expect more from them. They’ll seek out virtual personalities that have the power to entertain, educate, befriend and heal. For smart brands, it’s time to start thinking beyond virtual assistance – and about true virtual companionship.


    In the immediate future, device manufacturers are banking on voice-enabled devices to usher in a new era of smart homes controlled by the gadgets they sell. The winning virtual assistant will be the one that first achieves ubiquity. It’s about doing everything, and being everywhere.


    Big leaps in voice interaction require large volumes of data for machine learning to crunch. Marketers will need to have a comprehensive data strategy in place to improve the value of their services.


    As shopping powered by voice technology gains traction, marketers will rethink their business models. Modern voice systems are built around conversations, through intelligent multi-stage conversational interfaces, so brands will have to make shopping for their products and services an intuitive experience. Brands should also look out for new opportunities as the likes of Amazon and Google seek to monetise their smart speakers, by ads or other commercial partnerships.


    Republished from Zenith’s ‘Global Intelligence 2018 – The Year Ahead’ report


  • Executive Summary of Zenith AdEx forecast for 2018

    Zenith predicts global ad expenditure will grow 4.1% in 2018, reaching US$578 billion by the end of the year. This forecast is fractionally below the 4.2% rate we predicted for 2018 in September, with marginal downgrades in North America, Western Europe and Asia Pacific, and upgrades in Latin America and Central & Eastern Europe.


    We expect advertising expenditure to grow more slowly that the global economy as a whole out to 2020.


    Growth of advertising expenditure and GDP 2017-2020 (%)

    Source: Zenith/IMF


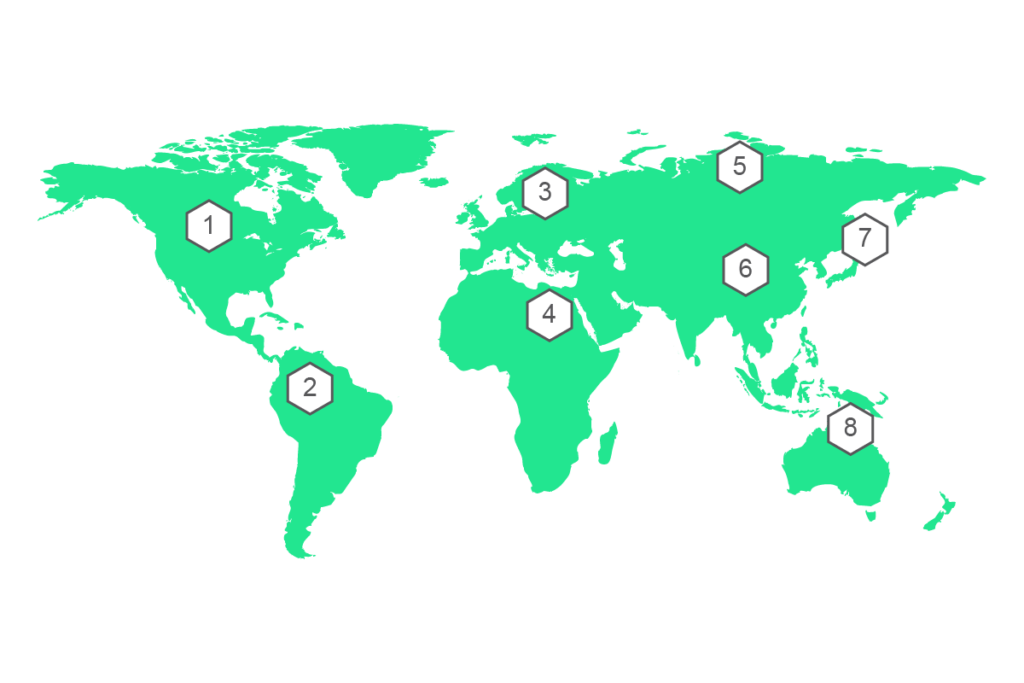
    Forecast by regional bloc


    We regularly examine the growth rates of different regional blocs defined by the similarity of the performance of their ad markets as well as their geographical proximity. This captures the behaviour of different regional ad markets more effectively than looking at regions defined purely by geography, such as Western Europe, Central & Eastern Europe and Asia Pacific. See the end of the Executive Summary for a complete list of countries by bloc.

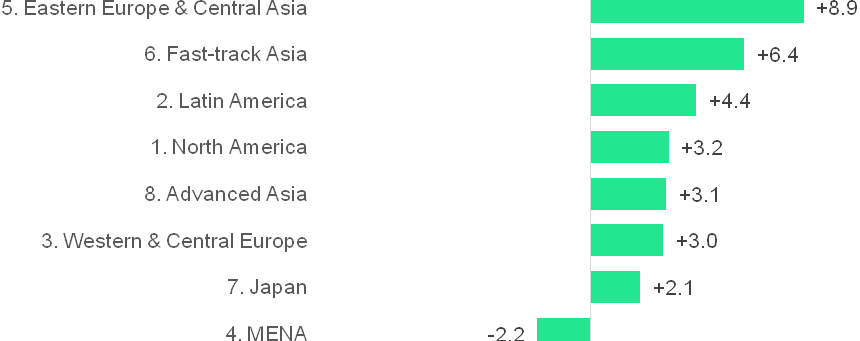
    Growth in adspend by regional bloc 2017-2018 (%)

    Source: Zenith


    1. North America

    North America was the first region to suffer the effects of the financial crisis, but it was also quick to recover, and adspend in North America was more robust than in Western & Central Europe between 2012 and 2014. This changed in 2015 as the European markets most affected by the eurozone crisis recovered rapidly, while declining network television ratings eroded US adspend growth. North America started outperforming Western & Central Europe again in 2016 as political and economic uncertainty in the UK dragged down growth in the latter, and Canada’s healthy economy boosted its ad market. We expect North American adspend to grow 3.4% in 2018, and forecast an average of 3.2% growth a year to 2020.


    1. Latin America

    Argentina, Brazil, Ecuador and Venezuela (which account for 64% of Latin American advertising expenditure) were in recession in 2016, compounded by rapid devaluation in Argentina and full-blown crisis in Venezuela, which is running out of basic supplies and is heading for hyperinflation. Adspend in Latin America shrank by 0.6% in 2016, after growing 7.8% in 2015. Argentina and Brazil are now out of recession, and Venezuela’s sustained collapse in adspend means that its continued decline weighs less on the regional total each year. We forecast 2.8% growth in Latin America adspend this year, 3.4% next year, and 4.4% average annual growth to 2020.


    1. Western & Central Europe

    Western & Central Europe was one of the regions most affected by the financial crisis of 2008-2009, which then turned into the eurozone crisis. The eurozone crisis is not definitively over, but the region’s ad market has been enjoying solid recovery since 2014, after which adspend grew at about 4% a year.


    The UK was the stand-out growth market in Western & Central Europe from 2011 to 2016, growing at an average of 7.3% a year. However, a slowing economy, gathering inflation, and political uncertainty over the mid-year elections and Brexit negotiations have all contributed to a sharp slowdown in UK adspend this year, which we expect to grow just 0.7% across 2017. And although the eurozone economy has strengthened this year, this has not yet fed through to advertising. We estimate that adspend will have risen just 1.3% in the eurozone by the end of 2017, before accelerating to 2.5% growth in 2018. We now forecast 1.7% growth in Western & Central European adspend this year, down from 3.9% growth in 2016. But we think this will be a low point, and expect anannual average of 3.0% growth to 2020.


    1. MENA

    The drop in oil prices in 2014 has had a severe effect on the economies in MENA, and has prompted advertisers to cut back their budgets in anticipation of lower consumer demand. Political turmoil and conflict have worsened, further shaking advertisers’ confidence in the region. We forecast an 18.6% drop in adspend in MENA this year, following 10.0% decline in 2016. The region’s decline should moderate in 2018 and 2019, and we forecast very modest 0.4% growth in 2020.


    1. Eastern Europe & Central Asia

    Ad markets in Eastern European & Central Asia generally recovered quickly after the 2009 downturn and then continued their healthy pace of growth for the next few years. In 2014, though, the conflict in Ukraine severely disrupted the domestic ad market, while Russia suffered from sanctions imposed by the US and the EU, the sanctions it imposed in response, and a withdrawal of international investment. These shocks were exacerbated by a sharp drop in the price of oil – which accounted for 70% of Russia’s exports in 2014 – and devaluation of the Ukrainian and Russian currencies.


    Adspend shrunk 0.2% in Eastern Europe & Central Asia in 2014, and by 8.8% in 2015. The worst-affected ad markets began to recover in 2016, however, and this recovery has continued in 2017, consistently outperforming expectations. We now think adspend will be up 11.1% in 2017, after which growth will settle down to a more normal 8.9% a year to 2020, ensuring that Eastern Europe & Central Asia remains the fastest-growing regional bloc over this period.


    1. Fast-track Asia

    Fast-track Asia is characterised by economies that are growing extremely rapidly as they adopt Western technology and practices and innovate new ones, while benefiting from the rapid inflow of funds from investors hoping to tap into this growth. Fast-track Asia barely noticed the 2009 downturn (ad expenditure grew by 7.8% that year) and since then has grown very strongly, ending 2016 up an estimated 9.0%. However, the Chinese economy – the main engine of growth in Fast-track Asia – is slowing down after years of blistering growth, and the ad market is slowing alongside it. The extended period of mourning for King Bhumibol Adulyadej has led to a second year of decline for Thailand, and Malaysia’s recovery from the downturn of 2016 has been less rapid than we hoped. We expect ad expenditure in Fast-track Asia to grow 7.6% in 2017, and at an average rate of 6.4% a year between 2017 and 2020. This is less rapid than the growth in Eastern Europe and Central Asia, but Fast-track Asia is ten times larger, so contributes a lot more to global adspend growth.


    1. Japan

    Japan behaves differently enough from other markets in Asia to be treated separately. Despite recent measures of economic stimulus, Japan remains stuck in its rut of persistent low growth. We forecast average adspend growth of 2.1% a year between 2017 and 2020, slightly behind the average annual growth rate of 2.4% between 2012 and 2017.


    1. Advanced Asia

    Apart from Japan, there are five countries in Asia with developed economies and advanced ad markets that we have placed in a group called Advanced Asia: Australia, New Zealand, Hong Kong, Singapore and South Korea. Adspend grew here at 5.3% in 2015, the best performance since 2011, but has slipped back to an estimated 1.6% this year. We expect this to be the trough, and forecast 3.1% average annual growth to 2017, fractionally above the 2.9% average growth rate since 2012.


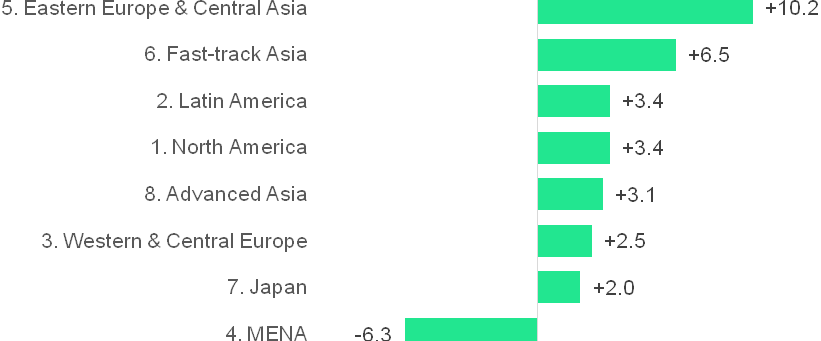
    Average annual growth in adspend by regional bloc 2017-2020 (%)

    Source: Zenith


    Of the various blocs, MENA is the clear underperformer, while the clear outperformers are Fast-track Asia and Eastern Europe & Central Asia. The other blocs range gradually from growing slowly (Japan) to solidly (Latin America).


    Forecast by leading advertising markets


    The US will be the leading contributor of new ad dollars to the global market over the next three years, making up in scale what it lacks in speed. China will come second, combining large scale and rapid growth (though its growth is slowing as its scale increases).


    Between 2017 and 2020 we forecast global advertising expenditure to increase by US$72billion in total. The US will contribute 27% of this extra ad expenditure and China will contribute 20%, followed by Indonesia, India, the UK and Japan, which will contribute 4% each.


    Five of the ten largest contributors will be Rising Markets* (China, Indonesia, India, Brazil and Russia), and between them they will contribute 33% of new adspend over the next three years. Overall, we forecast Rising Markets to contribute 54% of additional ad expenditure between 2017 and 2020, and to increase their share of the global market from 37% to 39%.


    Top ten contributors to adspend growth 2017-2020 (US$m)

    Source: Zenith


    The world’s top ten advertising markets by size will remain stable between 2017 and 2020, with only one change in the ranking when Indonesia replaces Canada in tenth place in 2019.


    Top ten ad markets

    US$m, current prices. Currency conversion at 2016 average rates.
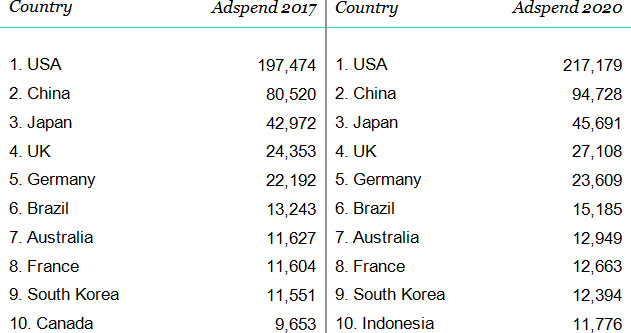
    Source: Zenith


    Global advertising expenditure by medium


    This year internet advertising has overtaken advertising in traditional television to become the world’s biggest advertising medium, accounting for 37.3% of total ad expenditure. As internet advertising matures, its growth is slowing down, but it remains the fastest growing medium by some distance. We estimate that internet adspend grew 13% year on year in 2017, and we forecast an average growth rate of 10% a year between 2017 and 2020. By 2020 we expect internet advertising to account for 44.3% of global adspend.


    Internet adspend by type 2017-2020 (US$ billion)

    Source: Zenith


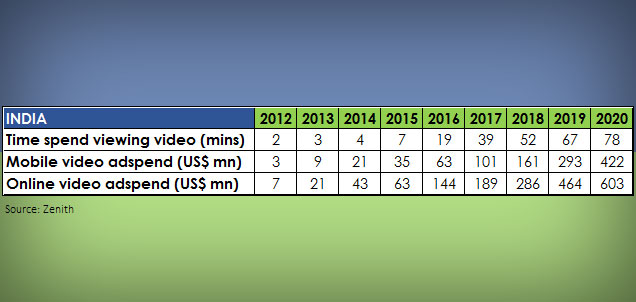
    Display is the fastest-growing internet sub-category, with 12% annual growth forecast to 2020. Here we include traditional display (such as banners), online video and social media. All three types of display have benefited from the transition to programmatic buying, which allows agencies to target audiences more efficiently and more effectively, with personalised creative. Online video and social media are currently the driving forces of internet adspend growth: we forecast online video advertising to grow by 17% a year on average between 2017 and 2020, while social media will grow by 16% a year. Online video is benefiting from the increasing availability of high-quality content, and improvements to the mobile viewing experience, such as better displays and faster connections. And for many consumers, checking their mobile devices for social media has become a regular, ingrained habit, while social media ads blend seamlessly into their mobile app newsfeeds. Note that these are not mutually exclusive categories: online video ads are now an important component of social media platforms’ revenues.


    Paid search and classified are now both lagging substantially behind display. Search is growing at 8% a year, and classified at 7%.


    Looking at internet adspend by device reveals the dramatic ascent of mobile advertising (by which we mean all internet ads delivered to smartphones and tablets, whether display, classified or search, and including in-app ads). We estimate that mobile advertising grew 33% in 2017, after 48% growth in 2016, and we forecast an average annual growth rate of 18% a year between 2017 and 2020, driven by the rapid spread of devices and improvements in user experiences. By contrast we forecast desktop internet advertising to shrink at an average rate of 1% a year as advertisers follow consumers to mobile.


    We estimate global expenditure on mobile advertising at US$106 billion in 2017, representing 52.2% of internet expenditure and 19.5% of total advertising expenditure (this total excludes a few markets where we don’t have a breakdown by medium). By 2020 we forecast mobile advertising to have grown to US$176 billion, well ahead of desktop’s US$95 billion total, having overtaken desktop in 2017. Mobile will account for 65.0% of internet expenditure and 28.8% of all expenditure in 2020 – more than all the traditional media except television put together.


    Share of global adspend by medium
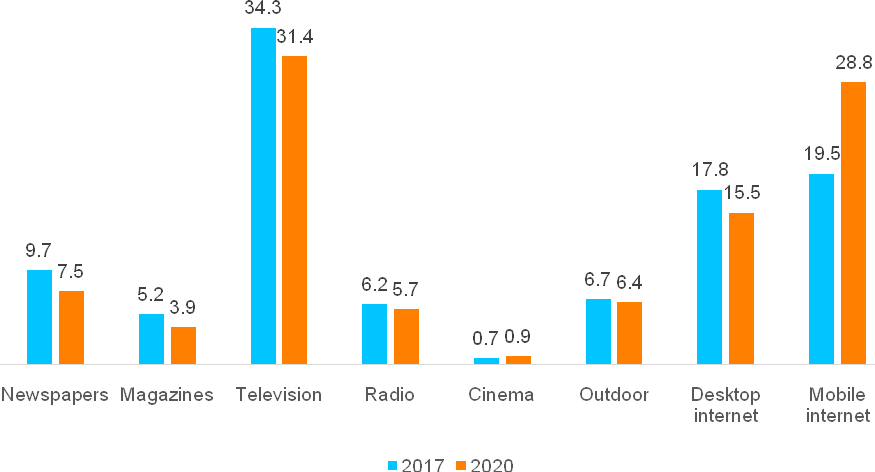
    Source: Zenith


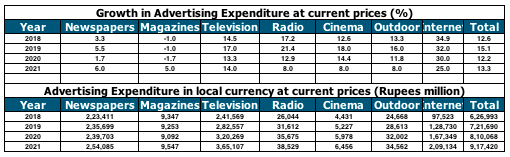
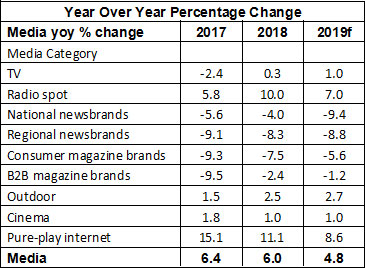
    Since it began in the mid-1990s, internet advertising (both desktop and mobile) has principally risen at the expense of print. Over the last ten years internet advertising has risen from 9% of total global spend (in 2007) to 37% (in 2017). Meanwhile newspapers’ share of global spend has fallen from 27% to 10%, while magazines’ has fallen from 12% to 5%. Print titles will continue to lose market share as their readers continue to move to online versions of the print brands or other forms of information and entertainment entirely. We predict newspapers and magazines will shrink at average rates of 4% and 6% a year respectively, ending with respective 8% and 4% market shares in 2020.


    Note that our figures for newspapers and magazines include only advertising in printed editions of these publications, not on their websites, or in tablet editions or mobile apps, all of which are picked up in our internet category. The performance of print editions does not describe the overall performance of newspaper and magazine publishers.


    Television was the dominant advertising medium between 1996 (when it overtook newspapers with a 37% market share) and 2016 (when it attracted 35% of total advertising expenditure). This year, however, the internet overtook television to become the largest advertising medium. Looking at the ad market as a whole, including search and classified, we think television’s share peaked at 39.3% in 2012, fell to 34.3% in 2017, and by 2020 expect it to fall back to 31.4%, its lowest share since 1981.


    However, one of the reasons for television’s loss of share is the rapid growth of paid search, which is essentially a direct response channel (together with classified), while television is the pre-eminent brand awareness channel. Television does not compete directly against search, and indeed the two can complement each other, for example by running paid search activity to take advantage of the increase in searches driven by a television campaign. Taking internet classified and search out of the picture, television will remain the principal display medium for many years to come. We estimate television accounted for 42.6% of display expenditure in 2017, and will attract 40.1% in 2020.


    If we consider audiovisual advertising as a whole – television plus online video – we see that it is in fact consolidating its dominant share of display advertising. Television offers unparalleled capacity to build reach, while online video offers pinpoint targeting and the potential for personalisation of marketing messages. Both are powerful tools for establishing brand awareness and associations. We estimate that audiovisual advertising accounted for 48.7% of display advertising in 2017, up from 43.7% in 2010, and expect its share to rise to 49.0% in 2020.


    Contribution to global growth in adspend by medium 2017-2020 (US$ million)
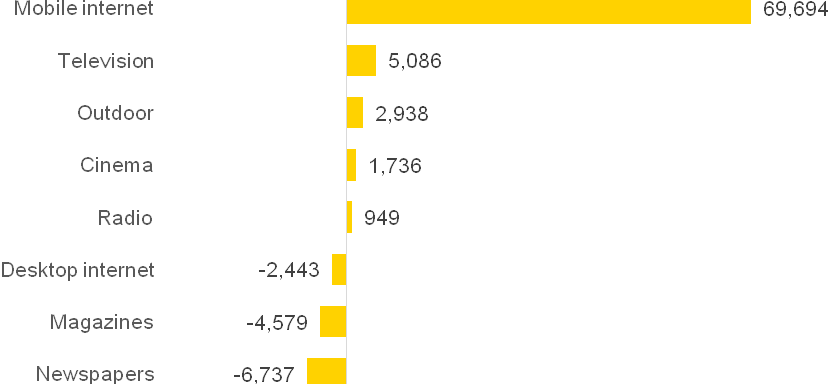
    Source: Zenith


    Mobile is by some distance the main driver of global adspend growth. We forecast mobile to contribute US$70 billion in extra adspend between 2017 and 2020 (again excluding markets where we don’t have a breakdown by medium). Mobile advertising’s growth will be counterbalanced by an US$2 billion decline in desktop advertising, as advertisers switch budgets to mobile, combined with an US$11 billion decline from print. Television and outdoor advertising will be the second and third-largest contributors, growing respectively by US$5 billion and US$3 billion, while cinema and radio grow by about US$2 billion and US$1 billion respectively.


    Appendix


    List of countries included in the regional blocs

    North America: Canada, USA

    Western & Central Europe: Austria, Belgium, Bosnia & Herzegovina, Croatia, Czech Republic, Denmark, Finland, France, Germany, Greece, Hungary, Ireland, Italy, Netherlands, Norway, Poland, Portugal, Romania, Serbia, Slovakia, Slovenia, Spain, Sweden, Switzerland, UK

    Eastern Europe & Central Asia: Armenia, Azerbaijan, Belarus, Bulgaria, Estonia, Georgia, Kazakhstan, Latvia, Lithuania, Moldova, Russia, Turkey, Ukraine, Uzbekistan

    Japan

    Advanced Asia: Australia, Hong Kong, New Zealand, Singapore, South Korea

    Fast-track Asia: China, India, Indonesia, Malaysia, Pakistan, Philippines, Taiwan, Thailand, Vietnam

    Latin America: Argentina, Brazil, Chile, Colombia, Costa Rica, Ecuador, El Salvador, Mexico, Panama, Peru, Puerto Rico, Uruguay, Venezuela

    Middle East & North Africa: Bahrain, Egypt, Israel, Kuwait, Oman, Qatar, Saudi Arabia, UAE


    *We define Mature Markets as North America, Western Europe and Japan, and Rising Markets as everywhere else


    Advertising Expenditure Forecasts is published quarterly priced £495, or £1,485 for an annual subscription. It may be ordered in hard or soft copy from www.zenithmedia.com

  • Adspends to grow just 8.4% in 2018: Zenith


    By A Correspondent


    India is #4 in the Top 10 contributors to global adspend growth 2017-2020. But that’s perhaps the only statistic that indicates ‘achche din’ for adspends. India, btw, is not in the Top 10 adspend markets. Neither in 2017, and not even in 2020. But that’s a headline you’ll possibly read elsewhere. Let’s examine the real thing.


    First, take a closer look at the table above. Total adspends, according to Zenith, were Rs 491,658 million in 2016, Rs 539,183mn in 2017 and the forecast for 2018 is 584,217mn. Since we are still in early December 2017, one presumes the 2017 number of 539,183 is an estimate. But given that number, the adspend growth is 9.7% as compared to the forecast of 11.2% made last year. The forecast for 2018 is 8.4%, even lower than the estimated growth for 2017.


    Yes, you read it right. Zenith (eka Zenith Optimedia) believes that adspends will grow 8.4% next year in comparison to 9.7% this year. Remember, we are supposed to have seen the worst of the worst in 2017 given demonetisation last November and GST just ahead of the festive season. So why the not-so-achche din in 2018?


    Here’s what a communique says: Year 2017 will close atRs 53,918 crore, registering a slightly slower pace of growth is on account of demonetisation introduced in November 2016. Total AdEx for India will climb up to Rs58,422 crore, growing  at 8.4% in 2018, led by television. Growth rate for television is pegged at 9% while newspapers will grow at 5%. Radio will grow at 10%, while cinema and out of home will grow at 5% respectively.


    Tanmay Mohanty

    Said Tanmay Mohanty, Group CEO, Zenith India: “Growing Internet penetration accelerated by operators such as Jiowill significantly enhance digital adspends in India and give access to previously untapped markets. India has seen some fluidity in overall ad-expenditure but remains one of the fastest growing advertising markets globally.  With the dust settling down on demonetisation and GST, we expect a measured recovery on ad spends. Consumer confidence is definitely on the rise. In 2018, mobile handsets, FMCG, automobiles, BFSI, travel and tourism and political ads will drive up the pace on adspends.”


    Here’s more from the communique we received:

    Amid growing debate as to whether brands are overspending on digital media, Zenith research has found that the effectiveness of internet advertising has now caught up with digital adspend.


    Until 2015, brands struggled to make effective use of internet advertising, and their spend was not matched by the resulting ‘brand experience’(an accurate proxy of market share*). However, by 2016 internet advertising accounted for 34% of global ad budgets but produced 35% of brand experience.Internet advertising is now therefore working harder than advertising in other media.


    For many years Zenith’s Advertising Expenditure Forecasts reports have consistently reported sizeable increases in the internet share of advertising budgets. The December 2017 edition of the report is published today. For the first time Zenith has been able to demonstrate the ROI of internet adspend, not just its scale. We used our proprietary Touchpoints ROI Tracker tool to compare internet adspend to internet brand experience over the past few years.


    In 2014 advertisers spent 27% of their budgets on internet advertising, which produced only 21% of brand experience. By 2015, though, brands were using internet advertising more effectively: it accounted for 30% of both budgets and paid brand experience, before tipping over in 2016, when brand experience exceeded budget share.


    We expect internet advertising’s share of global adspend to continue to rise, reaching 40% in 2018 and 44% in 2020. Its value will rise from US$203bn in 2017 to US$225bn in 2020. The share of advertising expenditure allocated to internet advertising varies widely across the world. In the most advanced markets (Sweden and the UK) it will account for more than 60% of total expenditure next year, and it will account for between 50% and 60% in another six (Australia, Canada, China, Denmark, Norway and Taiwan).


    India is placed No 4 in the Top 10 contributors to global adspend growth 2017-2020.

    India follows USA, China and Indonesia in that order. (See executive summary)


    Between 2017 and 2020 we forecast global advertising expenditure to increase by US$72 billion in total. The US will contribute 27% of this extra ad expenditure and China will contribute 20%, followed by Indonesia, India, the UK and Japan, which will contribute 4% each.


    Five of the ten largest contributors will be Rising Markets* (China, Indonesia, India, Brazil and Russia), and between them they will contribute 33% of new adspend over the next three years. Overall, we forecast Rising Markets to contribute 54% of additional ad expenditure between 2017 and 2020, and to increase their share of the global market from 37% to 39%.


    In India, internet adspend will capture 11.6% of the market in 2017.  India is therefore a leading digital market/keeping pace with global developments/has a lot of scope for growth in internet advertising. We forecast 20.4 % growth in internet advertising in India in 2018, compared to 8.4% growth for the market as a whole. By 2020, internet will account for 15.4% of total adspend in India.


    The rise of the internet has had huge consequences for the other media, which are covered in detail in the executive summary.


    Big platforms are capturing digital growth

    The internet is driving the great majority of global growth in advertising – it will account for 94% of the growth in adspend between 2017 and 2020. And most of this will be captured by just five big platforms – Google and Facebook, plus the Chinese platforms Baidu, Alibaba and Tencent. Between them these five platforms increased their share of global internet adspend from 61% to 72% between 2014 and 2016, and captured 83% of the growth in internet adspend over that time. Baidu, Alibaba and Tencent accounted for 54% of the growth in internet adspend in China, while Google and Facebook accounted for 96% of the growth in internet adspend in the rest of the world. Between them Google and Facebook accounted for 76% of internet adspend outside China in 2016.


    Big countries are adding most ad dollars

    In dollar terms, most of the growth in global adspend is coming from a few big markets. We forecast that just two countries – the US and China – will contribute 47% of new ad dollars between 2017 and 2020. The five biggest markets – the US, China, Japan, the UK and Germany – will contribute 57%.


    Big cities are driving global adspend growth

    Big cities are driving global adspend by concentrating growth in productivity, innovation and trade. We have conducted a unique study that attributes adspend to individual cities by estimating the value of their inhabitants to local, national and international advertisers. We forecast that the top 10 cities alone will contribute 12% of all global adspend growth this year, and that the top 725 will contribute 60%.


    We predict that between 2016 and 2019, adspend in the 10 biggest-contributing cities will grow by a total of US$7.5bn, representing 11% of growth over these years. These ten cities will be, in descending order: New York (where adspend will grow by US$1.4bn), Tokyo, Jakarta, Los Angeles, Shanghai, Houston, Dallas, Beijing, London and Chicago (which will grow by US$0.6bn).


    Advertisers feel the pressure from digital transformation and polarisation of growth

    Advertisers are feeling pressure from the rapid transformation of their businesses, exemplified by the rapid shift of marketing communications to online media in response to changing consumer behaviour, and the polarisation of growth to big platforms, big countries and big cities. At the end of November we conducted the third in our series of exclusive surveys about brand growth among key Zenith clients. On a scale from 0 to 100 – where 0 means everyone expects decline in 2018, 100 means everyone expects growth, and 50 means the average expectation is for no growth – the average response was 57, down from 67 this time last year. Food and drink brands have been the least affected, with a score of 66 this year, down just a point from 67 last year. Packaged goods, retail and telecom brands have all fallen to 50, expecting no growth, down from positive scores last year.


    “We are seeing a battle played out in business, marketing and media between big players and small players,” said Vittorio Bonori, Zenith’s Global Brand President. “Growth is coming from big countries and big cities, and being captured by big platforms. Brands should focus on upstream strategy, data-informed UX planning and downstream automation”.


    “Internet advertising is the biggest advertising medium in the world and the biggest driver of growth,” said Jonathan Barnard, Head of Forecasting and Director of Global Intelligence at Zenith. “Our unique research shows that brands are starting to use it effectively after struggling to adapt over the last few years.”


    *Brand experience is a combination of two factors: reach (how likely consumers are to encounter brand messages at eachtouchpoint) and influence (how likely each message is to consumer attitudes or behaviour). It covers all touchpoints across paid, owned and earned media, but because we were comparing it to advertising expenditure, here we measured only the brand experience of paid media.


    Touch points ROI Tracker is Publicis Media’s brand contact measurement and planning tool, based on more than 950,000 consumer interviews since 2004.


  • M&E brands most confident about business growth: Zenith survey

    By A Correspondent


    Advertisers in the media and entertainment category are most confident about seeing growth in their category this year. They are closely followed by advertisers in pharmaceuticals and healthcare.


    This is the key finding from Zenith’s just-released biannual client survey. Ahead of marketers attending Cannes Lions 2017, the study finds out what are the key drivers of growth and to assess how confident they are about business growth in their category.


    Zenith asked clients how confident they were in the prospects for growth in their category this year. It then ranked each category on a scale from 0 to 100, where 0 means everyone expects substantial decline, 100 means everyone expects substantial growth, and 50 means the average expectation is for no growth.


    The results were as follows: Media &Entertainment advertisers came out on top, with a score of 82.1, followed by Pharmaceuticals &Healthcare and alcohol. The lowest-scoring category was telecommunications, at 33.3, followed by Food &Drink and FMCG (non-food).


    Ranking of categories by advertiser confidence in growth

    Survey of 158 key Zenith clients around the world

    Category

    Confidence index

    Category

    Confidence index

    1. Media & entertainment

    82.1

    7. Travel

    61.4

    2. Pharma/healthcare

    70.3

    8. Retail

    60.0

    3. Alcohol

    70.0

    9. FMCG (non-food)

    55.7

    4. Luxury

    67.6

    10. Financial/insurance

    53.6

    5. Beauty

    67.2

    11. Food & drink

    48.4

    6. Automotive/vehicles

    63.6

    12. Telecommunications

    33.3


    Key drivers of business growth

    The study also asked Zenith clients to look at the drivers of business growth, ranking them according to how important they believed they were for their brand. From most important to least important, the factors were ranked as follows.


    Ranking of contributing factors to business growth

    Survey of 158 key Zenith clients around the world

    1. Data & technology

    2. Business transformation

    3. New competitive positioning

    4. Geographical expansion

    5. Diversification

    6. Automation

    7. Mergers & acquisitions


    The first three factors were ranked closely together, with quite a big gap between numbers 3 and 4. Adapting to the challenges of a transforming economy is clearly the main priority for advertisers.


    Translating growth in data to business growth

    The study asked clients how the huge increase in data has affected three areas of their business: buying efficiency, creating new insights into consumers, and generating profitable brand growth. For each area it gave them five options: data has made it more difficult, has had no effect, has slightly improved it, has greatly improved it, or has revolutionised it. And for each area there was one overwhelmingly popular response, with 50% or more of responses. These were as follows:

    :: The huge increase in data has allowed us to make small improvements in buying efficiency.

    :: It has allowed us to create much better insights.

    :: It has improved brand growth slightly.


    So while most clients agreed that data has significantly improved their consumer insights, it has not yet transformed their buying efficiency or brand growth.


    “Brands have the opportunity to harness data and technology to transform their businesses and accelerate brand growth, but are having difficulty in turning theory into practice,” said Vittorio Bonori, Zenith’s Global Brand President. “Agencies must step up and work in partnership with their clients to unlock the true potential of this revolution in communications.”


  • Zenith wins media business of Citrus Pay and LazyPay

    By A Correspondent


    Zenith, part of Publicis Media India, has won the full range of media duties of payments solutions brands Citrus Pay and LazyPay. Both are a part of fintech company PayU India.


    Tanmay Mohanty

    Said Tanmay Mohanty, Group CEO, Zenith: “We are pleased to have won the media business of two innovative and ambitious digital payments solutions brands Citrus Pay and Lazy Pay… We look forward to delivering spectacular results for The Payu Team.”


    Added Abhijit Bhattacharya, Head Marketing, Consumer Business from PayU India, says, “Zenith is a great strategic partner to have, with a wealth of experience in the financial services and payments sector. We look forward to a long and fruitful partnership.”