Tag: Adspend

  • India Shining, in Adspend Growth Projections


    By Our Staff


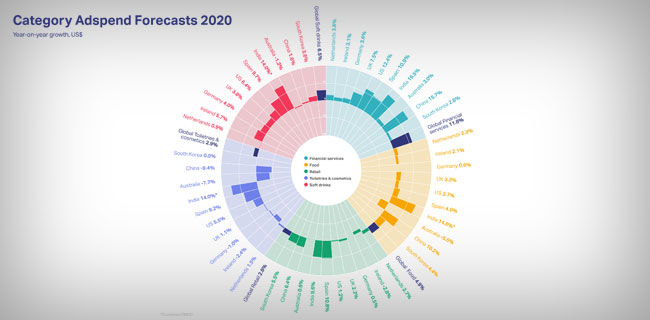
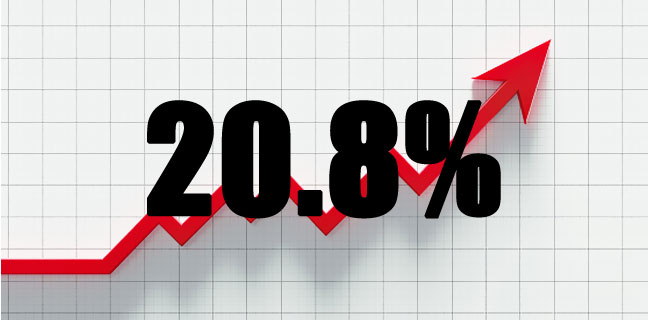
    India is in fifth place of adspends, accounting for 4.6% of the growth this year, even though it is only the twelfth-largest ad market. India will be the fastest-growing market in percentage terms, expanding by 20.8%, driven by election advertising and the resumption of festivals that were cancelled at the height of the pandemic.


    Jai Lala
    Jai Lala

    Said Jai Lala, CEO, Zenith India: “India continues to have a robust AdEx growth on the back of Digital and TV. Key categories continue to be led by FMCG and the new app-based clients in the area of Fintech, Edutech, Foodtech amongst others.”


    Global adspend is forecast to increase by US$58 billion in 2022, rising to US$781 billion from US$723 billion in 2021. Most of the new ad dollars will come from the US, which is forecast to expand by US$33 billion in 2022, driven by continued, rapid digital transformation, accounting for 57% of all the money added to the ad market this year. China, Japan, and the UK come next, supplying 9.1%, 6.2%, and 5.8% of new ad dollars, respectively.


    Global advertising expenditure is forecast to grow 8.0% in 2022, according to Zenith’s latest Advertising Expenditure Forecasts report, published today (June 8). This represents a minor downgrade from the 9.1% growth rate Zenith published in December 2021. Growth will be supported by the Winter Olympics, mid-term US elections and soccer World Cup, which for the first time will take place in the most advertising-intensive period of the year in the run-up to Christmas. Faced with this tough comparison, growth will slow to 5.4% in 2023, before the Summer Olympics and US presidential elections help boost it to 7.6% in 2024.


    Zenith’s forecasts for North America, MENA and Western Europe this year are unchanged at 12%, 7% and 6% growth respectively. Latin America was downgraded slightly from 9% to 8%, but Asia Pacific was upgraded from 6% to 7%, thanks to a very strong performance from India. Severe disruption in Russia and its closest trading partners after the invasion of Ukraine will lead to a 26% decline in adspend in Central & Eastern Europe, even though most other markets in the region will continue to grow.


    Adspend has remained on track despite the macroeconomic headwinds that emerged this year. High inflation, concentrated in essentials like heating, petrol, and food, is forcing consumers to reprioritise their spending, particularly the less well-off, and has led to a drop in consumer confidence. But for now, consumer spending continues to grow, as consumers demonstrate their strong appetite for the travel and entertainment experiences that were denied to them over the pandemic. Business confidence is generally high, and corporate investment is rising, and there is little evidence of widespread cost-cutting.


    Higher prices in traditional channels accelerate shift to digital alternatives

    The sustained growth in demand from advertisers is pushing up media inflation, particularly in television, where the supply of audiences is falling steadily as viewers switch to alternatives. Price rises vary widely for different audiences in different countries, but the global average cost of television advertising across all audiences is expected to rise by 11%-13% this year. Online video prices are expected to increase by about 7%, although in this case the supply of audiences is rising. Other digital channels where supply is climbing and volumes are flexible are inflating only modestly, with 3% average price rises forecast for social media and other digital display. Out-of-home and radio prices will go up about 4% this year, while print prices will remain stable, because demand for advertising in printed publications is falling as rapidly as readership.


    Brands that simply buy broad audiences to achieve reach targets will not be able to avoid having to spend more to reach the same audiences. But brands that use first-party data to identify their most profitable customers, and combine it with third-party data to target their best prospects in the most efficient channels, will be able to mitigate much of the effect of media inflation. The huge and growing volume of digital content consumption is making it more effective for brands to scale by aggregating digital audiences. Zenith predicts 62% of ad budgets will be spent on digital media in 2022, up from 59% in 2021, and that this proportion will reach 65% in 2024.


    “In a world where trading is becoming dominated by auctions, competitive advantage is achieved not by scale, but by data,” said Ben Lukawski, Global Chief Strategy Officer, Zenith. “Inflation will hit cheap reach buyers hard, but brands that make smart use of their data will manage costs and grow their business at the same time.”


    Online video overtakes social media as the fastest-growing channel for the first time in past decade

    Online video is now predicted to be the fastest-growing channel over the next three years: Zenith forecasts it will grow 15.4% a year on average between 2021 and 2024, driven by the rapid development of connected TV, ad-funded video-on-demand, streaming and other video formats. Connected TV is now a mainstream video platform in the US, with a higher penetration than cable TV, and is becoming established in other markets, especially in Western Europe and Asia Pacific. The introduction of cheaper ad-funded tiers by SVOD services like Netflix and Disney+ will boost growth further by providing new high-quality environments for brand communication. Mixed video-on-demand models that combined subscriptions with advertising will also help online video audiences continue to grow across the world by recruiting consumers unwilling or unable to afford the growing roster of subscription-only services. Zenith expects online video adspend to rise from US$62 billion in 2021 to US$95 billion in 2024.


    Online video will overtake social media, the fastest-growing channel for the previous nine years. Social media adspend (which includes video ads in social media feeds) is still forecast to grow at an average rate of 15.1% a year between 2021 and 2024, propelled by rising competition among platforms that is driving continued innovation on formats and closer integration with commerce. Meta’s share of social media adspend outside China has been falling steadily since it peaked at 89% in 2019, reaching 85% in 2021 as TikTok, Snapchat, LinkedIn and Pinterest gained market share. Zenith forecasts social media adspend will rise from US$153 billion in 2021 to US$187 billion in 2022, when it will account for 25% of expenditure on advertising across all media.


    Cinema and out-of-home will take third and fourth place among the fastest-growing media, averaging 11.9% and 8.0% annual growth between 2021 and 2024 respectively. These are still recovering from the deep losses they suffered in 2020 and 2021 when cinemas were closed, and consumers were confined indoors. Cinema and out-of-home have a lot of ground to make up, however, and are taking their time to do so. Many brands that were forced to find alternatives, often digital, have found them effective, and see little need to shift their budgets back again. Zenith expects cinema adspend to reach US$3.9 billion in 2024, well below its pre-pandemic level of US$4.8 billion in 2019, while out-of-home will reach US$45.0 billion in 2024, exceeding the US$42.3 billion it achieved in 2019 for the first time.


    Linear television advertising is forecast to grow by 1.1% a year on average between 2021 and 2024, from US$173.6 billion to US$179.2 billion, as price rises continue to compensate for loss of audiences. This ongoing decline in reach and efficiency will drive brands to digital channels, however, including online video. Television’s share of total adspend is forecast to fall from 24.6% in 2021 to 20.8% in 2024, while online video’s share increases from 8.8% to 11.1%.


    “Online video is growing by creating new opportunities for building brand awareness, complemented by social media’s capacity for cost-effective targeting with low barriers to entry,” said Jonathan Barnard, Head of Forecasting, Zenith. “Online video is steadily narrowing the spending gap with television, and will be half as large as television by 2024.”


  • Ecommerce and online video to fuel 11% recovery in global adspends: Zenith

    By Our Staff


    Global advertising expenditure will grow 11.2% in 2021, driven by exceptional demand for performance-led ecommerce advertising and brand advertising on online video, according to Zenith’s latest ‘Advertising Expenditure Forecasts’ report. Advertising expenditure will total US$669 billion this year, US$40 billion more than was spent before the pandemic in 2019.


    Growth in advertising expenditure is expected to remain robust in the medium term, with 6.9% growth forecast for 2022 and 5.6% for 2023.


    The coronavirus pandemic has accelerated the structural shift in the economy from bricks-and-mortar sales to ecommerce, driving more consumers than ever to research and complete purchases online. Brands have responded by forming partnerships with retailers and creating new direct-to-consumer operations, using performance-driven advertising – primarily in social media and paid search – to lead consumers down the path to purchase. Zenith forecasts that social media advertising will expand by 25% this year to reach US$137 billion, overtaking paid search in scale for the first time. Paid search will expand by 19% to reach US$135 billion.


    Much of this is new money to the ad market, coming from small businesses that have had to pivot rapidly to ecommerce to survive lockdowns, and from budgets that brands would previously have allocated to retailers to secure physical shelf-space, which they are now spending on display and search ads on retailer websites. The shift to ecommerce will slow down as coronavirus restrictions lift and economies open up again, but won’t go into reverse. Zenith expects ecommerce to continue to pull in incremental revenues to the ad market, driving 13% growth in social media and 12% growth in search in 2022.


    Audiences continue to migrate online, and online video viewing is growing rapidly, even as traditional television ratings shrink again after a one-off spike when lockdowns began in 2020. Advertisers value online video as a means of maintaining reach while television declines, but it’s an effective form of brand communication in its own right. Demand is strong, although the popularity of subscription-funded video-on-demand has helped limit the supply of high-quality online video available to advertisers. Zenith predicts that online video advertising will be the fastest-growing digital channel in 2021, rising by 26% to reach US$63 billion. Specific numbers for India have not been given by Zenith in this forecast.


    Said Benoit Cacheux, Global Chief Digital Officer at Zenith: “The online video landscape continues to transform, fuelled by the growth of streaming services and connected TVs. Its continued evolution requires a radical rethink of how to build the optimal screen-neutral reach model. The ingestion of new data sources into TV planning also creates further opportunities to further sync TV and video planning.”


    Social media and online video have eclipsed traditional static display, which is forecast to shrink by 15% this year, while online classified grows by just 4%. Overall, Zenith expects digital advertising to grow by 19% in 2021, and increase its share of total adspend to 58%, up from 48% in 2019 and 54% in 2020.


    Most other media are enjoying growth this year, as spending rebounds from the 16% drop in traditional media adspend in 2020. Cinema and out-of-home were the worst affected by Covid-related restrictions, shrinking by 72% and 28% respectively, and will enjoy the fastest recovery in 2021, with respective growth rates of 116% and 16%. Radio advertising, which shrank by 22% in 2020, is forecast to grow by 4% in 2021, while television fell 8% in 2020 and is forecast to grow 1% in 2021. Print will continue its long decline, now in its 14th consecutive year, with an 8% drop in adspend in 2021. In 2023 adspend in all these media will still be below 2019 levels, though cinema and out-of-home will have made up almost all of their lost ground.


    Limited supply and rising demand are stoking media inflation

    This year’s rapid recovery in adspend, coupled with the continued migration of audiences from traditional to digital channels, is fuelling substantial increases in media prices, particularly in television. The cost of television advertising is up 5% this year on average, though the variance between markets and audiences is wide. Television spend is up by 1%, so the volume of audiences reached globally is shrinking. Digital media growth, in contrast, is mainly driven by rising audiences and more extensive monetisation, with online video inflation averaging 7%, and social media roughly flat, compared to their 26% and 25% respective adspend growth rates.


    US to add nearly half of all new ad dollars

    All regions will enjoy robust adspend growth in 2021, ranging from 9% in Asia Pacific to 15% in the Middle East and North Africa, which is recovering from the steepest decline in 2020, of 21%. The strongest underlying growth since 2019 is taking place in North America, which is forecast to grow by 13% this year despite shrinking by only 1% last year. Growth in North America is being driven by the very rapid pace of digital transformation in its industries, as well as strong investment in connected TV and advertising-funded video-on-demand.


    The US will be by far the largest contributor to global growth in 2021, accounting for 46% of the US$67 billion added to the global ad market this year, followed by China with 11%, and Japan and the UK with 6% each.


    “After a very tough year last year, the ad market is enjoying rapid and broad-based recovery, and will end this year well above the level it achieved in 2019,” added Jonathan Barnard, Head of Forecasting at Zenith. “Digital advertising is becoming a more effective tool for brand growth as media and commerce continue to move online, attracting greater investment from large brands and small businesses alike.”

  • Alcohol adspend to beat market with 5.3% growth in 2021 as hospitality opens up

    By Our Staff


    The Zenith’s Business Intelligence – Alcohol: Beer + Spirits has published its report. Alcohol adspend to rise from US$6.7bn in 2020 to US$7.7bn in 2023. Alcohol brands spend twice as much on television as the average brand, but will reduce their spending by 2.4% a year as audiences continue to shrink. Spirits brands have pivoted rapidly to owned online content, to help consumers replicate the brand experience – normally the main driver of sales growth – at home


    According to the report, digital advertising to account for 30% of alcohol adspend in 2023, up from 21% in 2019. Alcohol adspend in 12 key markets will grow by 5.3% in 2021, ahead of the 4.9% growth of the ad market as a whole, as brands recover from a much steeper drop in 2020. Alcohol advertising will then grow roughly in line with the market, with 4%-5% annual growth in 2022 and 2023.


    The pandemic has forced the alcohol brand experience to move online.


    Said Ben Lukawski, Global Chief Strategy Officer, Zenith: “Spirit brands have surpassed beer brands in terms of sales value by offering more premium experiences and rituals around their product and serve,” “With the pandemic taking audiences away from the on-trade we have seen a greater emphasis on bringing these premium experiences in home through owned digital content.”


    Consumers are now much more aware of the available options for buying alcohol online, and alcohol brands now have distribution networks in place to supply them. Zenith expects brands to expand their digital advertising to support alcohol ecommerce even after pubs and restaurants are fully open, fuelling 9.2% annual growth in digital adspend between 2019 and 2023, when digital advertising will account for 30% of alcohol advertising budgets.


    Zenith predicts alcohol brands will reduce their expenditure on television by 2.4% a year to 2023, compared to the 2019 baseline, as traditional broadcast audiences continue to shrink. Out-of-home advertising, by contrast, will grow by 1.1% a year, even taking into account the pandemic-induced reduction in foot and road traffic. Television’s declining reach makes out-of-home’s ubiquity even more valuable.


    Alcohol advertising to recover from 2020 decline by 2023


    Alcohol advertising shrank nearly twice as fast as the overall ad market in 2020, falling by 11.6% compared to 6.4% of the market as a whole, Brand finances were squeezed by reductions in consumption volume, the average price per drink, and profit margins. With bars, pubs and restaurants closed, consumers drank less alcohol, and bought the drinks they did consume from shops where they cost less, with a much lower mark-up. Brands cut back their marketing sharply to protect their bottom lines, and their combined adspend fell from US$7.6bn in 2019 to US$6.7bn in 2020.


  • UK adspend will grow by 15.2%: Advertising Association/WARC Expenditure Report

    By Our Staff


    The latest Advertising Association/WARC Expenditure Report, the only source to collect advertising revenue data across the entire media landscape, forecasts UK adspend will grow by 15.2% this year to reach a total of £27.0bn. This will recover the entirety of 2020’s £1.8bn decline and is expected to precede a 7.2% rise in 2022, by when the market will be worth a record £29.0bn. A 15.2% rise this year will offset a decline of 7.2% in 2020, while further growth is projected into 2022


    Ancillary forecasts suggest the UK is on course to achieve the strongest ad trade recovery of any major global market this year, and this puts the UK economy in a position to bounce back strongly post-pandemic, as every pound invested in advertising generates six in GDP.


    Adspend growth forecast for all media in 2021:

    Particularly strong results are expected for the media most adversely affected by the pandemic, namely cinema at +266.8%, digital out of home at +52.3%, and traditional out of home at +14.5%. Online classified investment is set to rise by a fifth (20.4%), supported by increased recruitment activity arising from brighter economic prospects this year.

    Other media are not expected to recoup 2020’s losses until next year, however. This is true of TV (up 8.8% in 2021), direct mail (up 6.4%) and publishing disciplines encompassing national news (up 7.3%), regional news (up 3.9%) and magazine brands (up 6.8%).

    Online display – inclusive of social media and online video – is set to see growth accelerate this year (+13.4%), as is the case for paid search (+18.4%). Taken together, these two sectors are expected to account for two-thirds (66.4%) of all UK advertising spend this year, up ten percentage points from a share of 56.2% in 2019.


    The full picture in 2020:

    The latest dataset includes final figures for Q4/FY 2020, which show spend on advertising declined by 7.2% to a total of £23.5bn last year. The decline in 2020 was softer than that following the Great Recession at the total market level, but most media owners recorded significant reductions in spend. In a positive end to last year, spend rose 2.6% during the final three months, resulting in the highest quarterly total on record (£7.0bn).

    The key findings for 2020 show a strong shift by advertisers into online video, social media and search markets, in a move part-reflective of the rapid acceleration of e-commerce, as lockdowns forced consumers to purchase goods and services from home. Spend on paid search went up 7.1%, online display rose by 10.4%, and TV VOD was up 15.7%. There was a small increase (0.5%) for online newsbrands, though other media saw sharp declines.

    The UK’s advertising industry was well-positioned for the challenges of the lockdown, as it already had one of the most developed digital ad markets in the world. The UK’s average weekly value of e-commerce spend rose 47.1% in 2020, to £2.1bn, which equated to 27.9% of all retail sales latest year – ahead of key international markets. For the first time, the UK was the country with the largest e-commerce share as a percentage of total retail spend. China’s equivalent figure was 24.9%, the EU was 20.0%, and the US was 14.0%.

    Among individual product categories, Government adspend grew 37.2% during 2020 as public health messaging was deployed in the effort to combat COVID-19. As normality returns, this spend is expected to fall back in 2021, with growth instead expected across the other main consumer categories, notably services (up 22.0%), industrial (up 19.8%) and financial (up 20.2%).


    Said Stephen Woodford, Chief Executive, Advertising Association: “Advertising investment has mirrored the rapid changes seen across the economy over the last year, primarily the acceleration provided by lockdowns towards e-commerce across all sectors able to sell online. The pandemic accelerated trends that were already changing the market, evident for several years. The UK’s sophisticated online advertising marketplace helped to keep the economy moving and, no doubt, supported businesses, large and small, to stay connected with consumers who were no longer on the high street. SMEs that had little or no online presence quickly adapted to serve their customers via online platforms and more sophisticated online businesses increased their investment behind these. Across the economy that advertising serves we saw remarkable innovation and agility, which helped to lessen the economic impact as firms adapted to keep serving their customers, despite the disruption. The predicted growth this year of 15.2% is good news, with every £1 of advertising spend generating £6 of GDP, this will be a welcome boost for jobs and growth in the wider economy.”


    Added James McDonald, Head of Data Content, WARC: “The data from 2020 were unlike any we have seen in our 40 years of market monitoring. Save for a flock of online pure-players, the majority of media owners surveyed by WARC experienced their worst trading climate in living memory. This was true at both the financial and the human level – many will not witness a full recovery until 2022 at the earliest. Agile formats with short lead times were seen to flourish last year, particularly within social media and e-commerce environments, the latter benefitting greatly from stay-at-home orders and well-established logistical networks. Media owners in these spaces are expected to build on good 2020 results this year, though the situation will be more challenging across the remainder of the landscape as ad investment continues to favour performance marketing.”


    Media
    2019
    £m
    2020
    £m
    2020
    year-on-year
    % change
    2021 forecast year-on-year
    % change
    2022 forecast year-on-year
    % change
    Search
    7,814.9
    8,369.0
    7.1%
    18.4%
    10.8%
    Online display*
    6,404.5
    7,070.8
    10.4%
    13.4%
    7.9%
    TV
    4,930.0
    4,350.0
    -11.8%
    8.8%
    2.1%
    of which VOD
    451.7
    522.7
    15.7%
    14.3%
    13.9%
    Online classified*
    1,399.0
    975.6
    -30.3%
    20.4%
    2.2%
    Direct mail
    1,383.0
    909.0
    -34.3%
    6.4%
    -7.3%
    Out of home
    1,300.8
    699.1
    -46.3%
    36.9%
    19.2%
        of which digital
    694.0
    414.9
    -40.2%
    52.3%
    24.6%
    National newsbrands
    996.2
    755.0
    -24.2%
    7.3%
    0.5%
    of which online
    317.1
    318.8
    0.5%
    10.9%
    7.7%
    Regional newsbrands
    719.5
    470.1
    -34.7%
    3.9%
    -1.0%
    of which online
    238.8
    183.3
    -23.3%
    7.3%
    5.5%
    Magazine brands
    654.5
    461.9
    -29.4%
    6.8%
    0.1%
    of which online
    264.1
    199.4
    -24.5%
    15.8%
    4.6%
    Radio
    702.7
    613.9
    -12.6%
    12.9%
    2.4%
    of which online
    49.3
    46.8
    -5.0%
    14.0%
    5.6%
    Cinema
    299.1
    54.7
    -81.7%
    266.8%
    61.1%
    TOTAL UK ADSPEND
    25,283.1
    23,458.1
    -7.2%
    15.2%
    7.2%
    Note: Broadcaster VOD, digital revenues for newsbrands, magazine brands, and radio station websites are also included within online display and classified totals, so care should be taken to avoid double counting. Online radio is display advertising on broadcasters’ websites.
    Source: AA/WARC Expenditure Report, April 2021


  • Adspend is now forecast to shrink 7.5% in 2020, compared to July’s 9.1% forecast: Zenith

    By A Correspondent


    The global ad market has recovered more rapidly than expected from the severe slump in Q2 caused by the coronavirus pandemic and is now forecast to shrink by 7.5% to US$587bn across 2020 as a whole, according to Zenith’s Advertising Expenditure Forecasts, published today. This is a marked improvement on Zenith’s forecast of a 9.1% decline in July.


    Zenith predicts that global adspend will grow by 5.6% to US$620bn in 2021, boosted by the favourable comparison with 2020, as well as the delayed Summer Olympics and UEFA Euro football tournament. Despite this bump, spending will remain below the US$634bn spent in 2019. In 2022, adspend will grow by 5.2% to reach US$652bn, exceeding 2019 by US$18bn, though it will be about US$70bn lower than it would have been if it had remained on its pre-pandemic track.


    These forecasts assume that the global economy will start a sustained recovery as Covid-19 vaccines are introduced in 2021, and are subject to the wide uncertainty over how rapid this recovery will be.


    Zenith predicts that global digital adspend will rise 1.4% in 2020, and increase its share of total adspend to 52%, up from 48% in 2019. The pandemic has forced brands to step up their digital transformation, as ecommerce has proved a vital tool for maintaining relationships with existing customers, mitigating the loss of in-store sales, and even finding new customers. Euromonitor International forecasts that ecommerce sales will increase 25% this year, while in-store sales drop by 5%. Brands have increased their spending on digital media to promote and drive traffic to their own ecommerce operations and to retailer partners. Search and social media, up 8% and 14% respectively, have proved particularly useful for these purposes.


    The growth of ecommerce is not expected to reverse once the world starts to recover from the coronavirus pandemic. Now that brands have proved the value of digital transformation under stress, they are likely to press ahead with it enthusiastically, devoting even more of their budgets to digital advertising. Zenith forecasts that digital advertising will account for 58% of global adspend by 2023.


    Advertising on connected TV is compensating for the rise of SVOD: Consumers’ viewing habits have been evolving for years, but 2020 saw a real step change as online video platforms benefited from a long-term boost to awareness and demand. Forced to spend much more time at home, consumers flocked to existing SVOD platforms like Netflix, which added 25 million new subscribers in the first half of the year, and new ones like Disney+, which achieved its five-year growth target in just nine months.


    Importantly for advertisers, who are locked out of SVOD platforms, demand for ad-funded video on demand (AVOD) has been even stronger, especially on connected TV sets. Between January and April 2020, the reach of SVOD services on connected TV in the US rose by 5%, but the reach of AVOD services rose by 9% to 58.5 million households, or 48% of the total1.


    AVOD combines the premium viewing environment of television with the data-fuelled targeting capabilities of digital advertising. It offers high ad recall, and high reach among young audiences that are hard to find on traditional TV. As it continues to grow over the next few years it will counterbalance the loss of audiences to SVOD and help fuel an average of 8.4% annual growth in online video adspend between 2020 and 2023.


    “Now that it offers mass reach in key markets, it’s the right time for brands to invest in connected TV,” said Christian Lee, Global Managing Director at Zenith. “Brands should use connected TV for both branding and performance, exploiting its high ad recall and full targeting and tracking capabilities to drive awareness and sales conversions at the same time.”


    Retailer media is diverting commercial budgets to advertising: The spike in ecommerce this year fuelled rapid growth in demand for retailer media – display or search ads that appear on retailer platforms and direct users to products available for purchase there. This is a well-established channel in China but is relatively new elsewhere. By promoting products at the point of purchase, it acts more like in-store displays than traditional above-the-line advertising, and brands commonly pay for it from commercial budgets set aside for negotiating with retailers, rather than from marketing budgets. It can therefore grow without cannibalising existing ad expenditure. Amazon is the main supplier of retailer media outside China, and its revenues grew by more than 40% year-on-year every quarter in 2020.


    Retailer media has huge potential for growth globally, given that its market share outside China (3%) was less than a sixth of its market share in China (19%) last year. Zenith estimates advertisers spent US$35bn on retailer media in 2019, and will spend US$51bn in 2020, up 46% year on year.


    “Retail platforms are powering their growth by putting pressure on brand margins. Their focus on bottom out price wars, and enhanced consumer experiences, benefit consumers while brands bear the cost,” said Ali Nehme, Global Chief Commerce Officer, Publicis Groupe. “In this scenario, brands must flex their own power, by selecting retailer partners who offer demonstrable value through transparent data and measurement, as well as the ability to deliver the consumers who will drive much needed category growth.”


    Asia Pacific and Central & Eastern Europe to lead recovery: Adspend is forecast to bounce back to 2019 levels in 2021 in both Asia Pacific and Central & Eastern Europe. The successful containment of Covid-19 infections in many Asia Pacific markets has limited the economic damage and prepared the region for rapid recovery in 2021. Countries in Central & Eastern Europe have generally suffered more, but their ad markets are less developed – accounting for 0.4% of GDP compared to 0.7% in Asia Pacific – and they have a faster underlying growth rate. Zenith forecasts adspend in both regions to shrink by 6% in 2020 and grow by 7% in 2021.


    North America has fared better than any other region this year and is forecast to shrink by just 5.3% in 2020, but that’s partly owing to very heavy political spending in the run-up to the US Presidential election. The absence of political adspend will make the comparison look tougher for 2021, when Zenith forecasts just 3.3% growth. Adspend will then grow by 4.5% in 2022, which is when North America will return to pre-pandemic levels of spending.


    Western Europe, Latin America and the Middle East & North Africa (MENA) are all forecast to shrink by 12.3%, 13.8% and 20.0% respectively this year. Of these, Zenith expects the quickest recovery from Latin America, another underdeveloped advertising region with the fastest long-term growth rate of the three, which will overtake 2019 spending levels in 2022. Mature Western Europe will not return to 2019 levels of spending until 2023. MENA has been shrinking for years as a result of conflict, political instability and volatile oil prices, which the pandemic has only exacerbated. Zenith forecasts that adspend in MENA will still be 4.1% lower in 2023 than it was in 2019.


    “The global ad market has been recovering from its Q2 nadir throughout the rest of this year,” added Jonathan Barnard, Zenith’s Head of Forecasting. “The prospect of multiple effective vaccines gives us confidence that adspend growth will continue in 2021 and beyond, returning the market to 2019 levels in 2022.”


  • Video ent brands in India will spend 19% more in 2022: Zenith

    By A Correspondent


    Media agency network Zenith forecasts that in 2022, video entertainment brands are forecast to spend 19% more in India. Yes, that’s two years from now. Video entertainment advertising will shrink by just 0.2% in 2020 across ten key markets this year*, according to its Business Intelligence – Video Entertainment report, published today (Monday). Video entertainment adspend will far outperform the ad market as a whole, which will drop by 8.7% across these same markets.


    Spain and India to lead growth in video entertainment adspend

    The stable headline figures for growth hide considerable variation between the 10 markets. In 2022, video entertainment brands are forecast to spend 27% more than in 2019 in Spain, and 19% more in India, as mentioned earlier. Meanwhile, spending is expected to decline by 5% in the US and 7% in Australia over the same period.


    Spain and India both have fast-growing appetites for video-on-demand, especially on smartphones in India. India’s television ad market also enjoys rapid long-term growth – unlike in most Western countries – and should bounce back quickly in 2021.


    The US is the only market where video entertainment adspend is expected to continue to decline after 2020, as rising online revenues fail to compensate for the ongoing declines in TV advertising and pay-TV subscriptions, reducing available ad budgets. The video industry is healthier in Australia, but here the ad market as a whole is retrenching after the sudden halt to Australia’s 29 years of unbroken economic growth, so video brands can maintain share of voice without raising budgets.


    Said Jonathan Barnard, Zenith’s Head of Forecasting: “Consumers are currently benefiting from a generous supply of video content from brands vying for their loyalty. This competition is providing a large boost to video entertainment adspend this year. But this level of investment in both content and advertising will prove difficult to sustain for the long-term, and we forecast very little growth in 2021 and 2022.”


    The remarkable resilience of video entertainment adspend in this year of a global pandemic and subsequent recession is the result of increased demand from consumers, increased supply of content, and intense competition among video brands for viewers.


    Faced with spending much more time at home, consumers turned to video content to keep themselves informed and entertained. In France, for example, TV viewing time was 30% higher year-on-year in April, and was still 11% higher in August. Meanwhile online video platforms have invested huge sums in creating content to attract new viewers, forcing traditional broadcasters to up their game.


    Adspend by online video brands has far outpaced traditional television recently. In the US, online video brands increased their ad budgets by 142% in 2019, while television brands increased their spending by 15%. In the UK, adspend by online video platforms increased by 79%, while adspend by traditional television grew 34%. In both markets, television broadcasters and pay-TV platforms pushed up spending temporarily in response to their new competition, but this will prove unsustainable in the face of ongoing decline in their revenues, both COVID-19-related and structural. Meanwhile online video platforms have continued to raise their budgets as they seek to exploit the current window of opportunity to build a loyal customer base. Each platform is spending heavily to ensure that they are top of mind while consumers consider which ones to commit to for the long term.


    “Consumers are now faced with a vast and confusing array of programmes and films vying for their attention,” said Christian Lee, Global Managing Director, Zenith. “Video brands need to cut through this complexity and give consumers entertainment that matches their personal preferences with minimum fuss. Brands that provide compelling experiences and act as more than just repositories of content will be best positioned for growth in the long term.”


    Lockdown has made digital even more vital to video brands

    Video entertainment brands spend more on digital advertising, out-of-home and cinema than the average brand. Their reliance on out-of-home and cinema has posed a particular challenge this year, as they have been forced to compensate for lost audiences from empty cities and closed cinemas. This means even more digital spending, which is forecast to rise from 53% of total video entertainment spend in 2019 to 57% in 2020.


    Video entertainment adspend to exceed 2019 peak by 1.2% in 2022

    While video entertainment is expected to substantially outperform the market in 2020, Zenith forecasts it to underperform over the next two years, with no growth in 2021 and 1.3% growth in 2022. Online video platforms will have less capacity to raise budgets after spending heavily in 2020, and traditional TV broadcasters will be weighed down by shrinking revenues from TV advertising and pay-TV subscriptions. Nevertheless, Zenith expects video entertainment adspend to be 1.2% higher in 2022 than it was in 2019, while overall advertising will still be 0.6% below its 2019 peak.


    * Video entertainment refers to long-form video content, supplied either by conventional television or online, including free TV, pay-TV and online video-on-demand platforms. The markets included in this survey are Australia, Canada, Germany, India, Italy, Russia, Spain, Switzerland, the UK and US, which collectively account for 57% of all global adspend.


  • Adspend Scan – II: Things may not look as Bleak as they are Projected to be

    By Amit Ray, Priya Jacob and Team Network Media


    The Indian media, especially television, has been under tremendous pressure on advertising revenues ever since the nation went into lockdown – 10 weeks ago.


    While there have been several discussions about major advertisers having curtailed their adspends backed by the huge reduction in ad volumes, things may not look as bleak as they are projected to be.


    In fact, a closer look at the data spells a very different yet hopeful scenario – shedding some light on the changing consumer habits/ sentiments and a paradigm shift in the power that once controlled TV.


    :: 287 new brands/variants of different brands were being advertised on TV every week, during the last 6 weeks

    :: 37 product groups out of 472 odd listed products registered a growth in inventory bought on TV after Nation went into a lockdown from March 25.


    Interestingly, these 37 product groups accounted for more than 45% of TV inventory consumed during lockdown while before lockdown they accounted only for a meagre 22%.
    While it is no surprise that a few products from giants like HUL, GCMMF still feature in the list – a testament to being listed under essentials – the real story lies in those products which have come into foray.


    :: Time spent on gaming and number of online gamers have increased by 1.25 times. This has been capitalised by the online gaming industry whose inventory consumption saw an unprecedented growth of 151% during lockdown.

    :: Taking a cue, the banking industry is also pushing its digital products more than ever during these times. Internet banking and digital wallets have seen an increase of customers by 1.2 times – a fact corroborated by their fair consumption of the inventory as opposed to other products in the category namely home loans.


    One of the major categories to take hit is the ice-cream category, where the previous years have seen a copious amount of inventory being consumed by the Ice cream giants Amul and HUL. The current situation has led both corporates to cut on the inventory in this category.


    Considering that the pandemic will be still on the horizon in the coming few months and consumers are likely to continue to operate from their homes as opposed to their offices, it is only logical that the personal skin care segment which has taken a hit by 50%, will be relegated from the shopping lists of the consumers.


    That majors like Vicco and Emami have been completely absent during these Covid times is perhaps sign for upcoming decrease in the same segment.


    Currently, with the signs seen in the consumption pattern of media and inventory, it looks like the shopping cart of an average Indian consumer has already undergone a major change. May be the consumer has adopted quicker than any to live with this pandemic than to wait for it to subside.


    Sources: Adex (Pre Covid period: Weeks 1-12,2020 & Covid period: Weeks 13-21.2020)

    (1)- BARC India and Nielsen’s 8th Edition of TV viewership and smartphone consumption behaviour during COVID-19, compared to pre-covid period

    (2)-BCG’s ‘COVID-19 consumer sentiment research’


    Note: The analysis is based on the advertising seconds and not rupee spend.

    Given the industry report the reduction is much higher in rupee revenue when compared to advertising seconds


    Manu G Nath and Vaidehi Datta from Network Media also contributed to this article


  • Online ads to account for over half of $660bn adspend in 2020: WARC


    By A Correspondent


    Global advertising spend is set to rise by 7.1 per cent to $660 bn this year, buoyed by 13.2 per cent growth in internet investment. But traditional media, combined, are expected to record 1.5 per cent growth to $324.2bn – the first rise since 2011 – finds WARC, the international marketing intelligence service.


    The traditional media total is expected to be boosted by a return to growth for TV; here spend is set to rise 2.5  per cent to $192.6bn, helped in no small part by the US presidential election campaigns and the Summer Olympic Games in Tokyo. But advertising revenue for the duopoly (Alphabet and Facebook) is forecast to reach $231.9bn in 2020, having topped the TV total for the first time in 2019.


    Alphabet’s ad income is forecast to rise 10.5 per cent to $149.0bn worldwide, equivalent to 23 cents in every ad dollar. A full 72.4 per cent – $107.8bn – will come from Alphabet’s core Google search platform – this gives Google a 77.0 per cent share of the global search market. YouTube is expected to earn a further $18.5bn for Alphabet in 2020, a 22.1 per cent rise from 2019 and equivalent to 29.0 per cent of all online video adspend worldwide.


    Facebook’s ad revenue is projected to rise 19.0 per cent to $82.9bn; much of this growth is organic though the social network will benefit from the US presidential campaigns this year. Amazon’s ad income is set to rise 21.4 per cent to $17.1bn, Twitter’s 9.2 per cent to $3.3bn and Snap’s 34.1 per cent to $2.3bn. All will contribute to an overall rise of 13.2 per cent in internet ad investment this year, to a total of $335.4bn – over half (50.9 per cent) of the global total for the first time.


    Said James McDonald, Managing Editor, WARC Data, and author of the research: “Internet ad growth has been far stronger than the state of the global economy would suggest, rising seven times faster on average since 2015. But, regulation aside, online platforms are bound by the law of large numbers, and revenue growth is easing for key players like Alphabet and Facebook. We are yet to amend our forecasts in light of the COVID-19 situation, as we would expect – if the crisis is contained – displaced spend to be reallocated later in the year. Advertising’s relationship with GDP is strong, but a slowdown in economic output as a result of the virus will not necessarily translate into reduced advertising investment. If events such as the Tokyo Olympics and UEFA Euro 2020 tournament are postponed or cancelled, however, we would expect a notable impact.”


    All product categories are expected to see growth in 2020

    Adspend is set to rise across all of the 19 product categories monitored by WARC. The financial services sector is expected to lead growth, with a forecast rise 11.8% to $53.4bn in 2020. A full 53.9% of spend is directed towards online formats; banks in particular are looking to build brand resonance with youth demographics (increasingly via social media).

    At the other end of the scale, a rise of 2.6% in the retail sector is soft compared to the global rate of 7.1% but would still represent the strongest growth since 2013, lifting market value to $65bn.

    Consumer packaged goods (CPG) sectors such as soft drinks (+6.5% to $17.3bn) and food (+4.9% to $28.1bn) are expected to grow just behind the global rate this year, alcoholic drinks (+6.9% to $9.7bn) and automotive (6.8% to $57.2bn) are roughly par.


    Trends by platform

    • Alphabet: Alphabet’s advertising revenue – across Google Search, YouTube, and Google Network Members (third parties that host Google ads) – is forecast to rise 10.5% to $149.0bn this year – 22.6% of global advertising spend (up from 21.9% in 2019). This is before the deduction of traffic acquisition costs (TAC), which amounted to $30.1bn in 2019.

    • YouTube: Advertisers are forecast to spend $18.5bn on YouTube this year, a rise of 22.1% from $15.2bn in 2019. This gives YouTube a 29.0% share of all online video advertising spend, and a 2.8% share of total adspend.

    • Google: By far the largest service in Alphabet’s portfolio, Google’s ad income is expected to rise 9.9% to $107.8bn this year – 77.0% of global search spend and 16.3% of all adspend.

    • Facebook: Advertisers are expected to spend $82.9bn across Facebook, Messenger, WhatsApp and Instagram this year, a rise of 19.0% from 2019. This gives Facebook a 12.6% share of global advertising investment.

    • Amazon: Amazon is forecast to record double-digit ad revenue growth again this year, with income amounting to $17.1bn, a 21.4% rise from 2019. This gives Amazon a 2.6% share of global advertising spend.

    • Snapchat: Ad investment in Snapchat is forecast to rise 34.1% to $2.3bn in 2020, 2.2% of all social and messaging spend and just 0.3% of total adspend.

    • Twitter: Twitter’s ad income is expected to ease into single digits, with a total of $3.3bn representative of a 9.2% rise in 2020.


    Trends by media and format

    • TV: Spend is forecast to rise 2.5% to $192.6bn, 29.2% of all global spend this year. This only partially reverses a 4.4% dip in 2019. A third of the global TV total is transacted in the US – where, TV spend is set to rise 4.0% to $62.9bn. Just over $4bn will come from presidential campaigns.

    • Out of home: Spend across billboards, transport and retail/point of sale (PoS) locations is forecast to rise 5.9% to $43.5bn this year, the sixth consecutive year of growth. The sector is benefitting from the increasing penetration of digital sites in advanced markets.

    • Radio: Advertiser investment in radio is forecast to rise 1.8% to $32.8bn, recouping losses from a 1.3% dip in 2019.

    • Print: Spend is set to fall by $3.2bn, or 5.8% in 2020, but this is half the rate of decline recorded in 2019. Digital revenue now accounts for over a third of total ad income for publishers worldwide, though this share is closer to a half at the New York Times.

    • Social media: Spend is forecast rise 19.5% to $102.4bn this year, 15.5% of global advertising spend. Facebook (including Messenger, Instagram and WhatsApp) is expected to draw 80.9% of this investment, or $82.9bn, though this share is down from 81.2% in 2019. Just over 42% – $35bn – of Facebook’s ad revenue will come from the US this year.

    • Online video: Spend is forecast to rise 21.4% to $63.7bn this year, equivalent to 9.7% of global advertising spend. YouTube is expected to account for three in ten cents.

    • Search: Spend is forecast to rise 12.7% to $140.1bn in 2020, 21.2% of global adspend. Google is set to draw 77.0% of the market, down from 79.0% in 2019.


    Trends by region

    • North America: Total market growth forecast at 8.4% this year – to $250.3bn – following a 4.5% rise in 2019. The US ad market is expected to grow 8.8% to $238.2bn, while Canada is projected to grow 1.9% to $12.2bn

    • Asia-Pacific: Advertising spend is expected to rise 7.5% to $205.0bn in 2020, with China (+9.7% to $98.5bn), Japan (+3.2% to $40.2bn), Australia (+2.4% to $13.3%) and India (+15.6% to $11.2bn) all set to record annual growth.

    • Europe: European adspend is forecast to rise 6.9% to $158.7bn this year, with France leading key market growth at +10.0% (to $18.2bn). The UK (+3.2% to $31.3bn), Germany (+1.3% to $24.9bn), Italy (+2.7% to $10.5bn) and Russia (7.6% to $10.5bn) will continue to see rising investment.

    • Latin America: The region is heavily susceptible to the strength of the US dollar, which resulted in an 1.1% decline in adspend last year. A further fall, of 2.5%, is forecast this year, with Brazil recording a 4.3% dip to $14.3bn.

    • Middle East: Spend is expected to fall 1.7% to $12.0bn in 2020, following on from a 3.7% fall in 2019.

    • Africa: Spend is expected to rise 5.6% to $6.9bn this year, reversing a 1.5% dip in 2019.


    Other new key media intelligence on WARC Data across regions


    Global:

    Consumers: Ad blocking rises to all-time high of 764m people

    Brands & Advertisers: Food, drink and automotive brands see lowest email CTR

    Media & Tech:E-sports investment to reach $800m this year


    Americas:

    Consumers:One-quarter of Americans now own a smart speaker

    Consumers:Netflix subscriptions in Latin America top 30 million

    Media & Tech: NFL, NBA and MLB to draw $4bn from sponsors in 2020


    Asia Pacific

    Brands & Advertisers: Southeast Asian brands most active on WhatsApp

    Media & Tech: OTT to halve APAC pay TV growth by 2024

    Media & Tech: Sponsorship investment for Tokyo Olympics to triple


    Europe, Middle East and Africa

    Consumers: 26% of 18-24 year olds use TikTok in the UK

    Brands & Advertisers: Less than half of marketers use consumer data systematically

    Consumers:Connected TV use in Portugal flatlines for second year

    A sample of The Adspend Outlook 2020 report can be downloaded here.


  • Global adspend to grow to $656bn in 2020

    By A Correspondent


    WARC has found that advertising spend is set to rise next year across all 19 product categories monitored by WARC, culminating in global growth of 6.0 per cent to $656bn. This is a marked uptick from the 2.5per cent rise estimated for 2019 but is down on the 7.3per cent growth recorded last year.

    Eight product categories are set to increase advertising investment ahead of the global rate next year: financial services (+11.8per cent), household & domestic (+10.5per cent), transport & tourism (+9.0per cent), telecoms & utilities (+8.5per cent), technology & electronics (+8.4per cent), alcoholic drinks (+6.9per cent), automotive (+6.8per cent) and soft drinks (+6.5per cent). Internet is the fastest growing ad medium in each sector except technology & electronics, where out of home (OOH) is set to rise fastest at 11.4per cent.

    Globally, internet formats will account for over half of advertiser investment for the first time in 2020, with a combined value of $336bn. Investment in performance marketing, online video and social media is driving total market growth; advertiser investment excluding money spent on Facebook, Google and Amazon is flat or falling globally.

    The report states that Internet formats, combined, will account for over half of global ad investment for the first time in 2020, and social media, search and online video – the largest of these – are effectively shorthand for Facebook, Google and (Google-owned) YouTube. Google and Facebook, known as the ‘Duopoly’ drew two-thirds of online ad investment in 2018 before traffic acquisition costs (TAC) were paid out to Google’s partners, and WARC expects this share to rise closer to three quarters next year.

    Amazon is small by comparison but is becoming increasingly important to advertisers looking to connect with consumers close to the point of purchase. Amazon’s share of global ad investment is forecast to rise to 2.5per cent next year, Alphabet (Google and YouTube) 23.1per cent, and Facebook 12.9per cent (38.5per cent combined). The central role these three companies – known collectively as the ‘Triopoly’ – play in advertising is stark: advertiser investment beyond them has been flat since 2012.

    The report further states that growth in advertising investment is expected to be recorded within all 19 product categories monitored by WARC next year, although rates vary substantially.

    The financial services category leads with a projected 11.8per cent rise in spend to $53.4bn next year, as brands, particularly in the banking sector, are looking to connect with younger consumers on social media to inform often lifelong choices over their account provider. More than half of sector investment is directed towards online formats.

    The retail sector – the largest in this analysis – is expected to post the lowest growth next year, though a 2.6per cent rise would still be the strongest since 2013. Competition is fierce, from supermarkets to restaurants, and incremental dollars are mostly spent online, with TV, radio and print down over recent years.

    Said James McDonald, Managing Editor, WARC Data, and author of the research: “Weak macroeconomic indices, waning business confidence and rising geopolitical tensions have increased the possibility of a recession in 2020. Within this climate, our forecast of six percent growth in global advertising investment may seem optimistic, but these projections are in line with those from the IMF and Euromonitor for GDP and consumer spend, respectively,” adding:  “Incremental adspend during quadrennial events – the Tokyo Olympics and US presidential campaigns – may be muted next year but will still have a positive net contribution to global growth, as would a stronger yuan and a business-favourable ‘Brexit’. Advertisers also intend to increase spend on Google, Facebook and Amazon properties, with global media spend ultimately flat elsewhere.”


  • Globally, most products are moving adspends online: WARC report


    By A Correspondent


    TV still attracts over two-thirds of advertising investment within the soft drinks sector, while a similar share is seen in the food category – both sectors are far less likely to have been disrupted by e-commerce, so the need for high levels of digital adspend to facilitate a path to purchase is reduced.

    But across all categories, ad investment is shifting heavily into internet formats. The pivot to online advertising is particularly stark within financial services and retail, with both sectors having heavily developed digital platforms to serve their customers in recent years.

    These are some of the findings by WARC, the global authority on advertising and media effectiveness, drawn from an analysis of its newly relaunched WARC Data product, which provides a new industry standard measure of net advertising investment data across 19 product categories in 23 markets, including the United States, United Kingdom and China.


    Said James McDonald, Managing Editor, WARC Data, and author of the research: “In a multichannel world, it has become harder than ever to track campaign performance, measure ROI, or to even trust third-party data. Additionally, the problem is compounded by an environment of ad blocking, fraud, and consumer distrust, and is hazed by walled gardens, programmatic stacks and opaque practice. This results in millions of ad dollars wasted each year. But it is essential that ad investment works harder in the media mix to obtain optimal reach and effectiveness. As such, our latest research into product category insights provides vital data to help brand owners, agencies and media strategists and planners inform their decision making.”

    In WARC’s latest ‘Global Advertising Trends – Benchmarking ad investment by product category’, the industry intelligence included in the report sheds light on how different sectors value advertising media, and how this has changed over time.

    Key findings for five of the 19 product categories available include: 

    Financial Services

    :: Total global adspend in 2018: $43.2bn (+13.0% year-on-year)

    :: Median revenue ROI for successful campaigns: 2.93

    :: Media spend: Internet $19.7bn (+24.4% year-on-year). TV $12.9bn (+4.0%).

    :: Radio $3.7bn (+5.1%). Other $7.0bn (+6.7%)

    :: Ad/sales ratios: Financial services (3.6%). Banks, credit, loans (6.7%). Insurance (0.8%). Investment (1.5%).


    Close to half of the $43.2bn financial services brands invested in advertising last year was directed towards internet formats. The data show a dramatic shift to digital over the last five years; internet’s share of sector spend has grown 22.0 percentage points (pp) since 2013, to 45.5% last year. This is just above internet’s share of global adspend (44.1%). As a share of sales revenue, the sector spends 3.6% on advertising, rising to 6.7% among banks.


    Food

    :: Total global adspend in 2018: $25.3bn (+1.4% year-on-year)

    :: Median revenue ROI for successful campaigns: 2.93

    :: Media spend: TV $16.5bn (+1.0% year-on-year). Internet $3.7bn (+7.9%). Print $2.8bn (-12.7%). Other $2.3bn (+15.3%)

    :: Ad/sales ratios: Food (2.6%). Confectionery (5.6%). Dairy (0.6%). Meat, fish, poultry (0.7%).


    Almost two-thirds of the $25.3bn in ad investment within the food category last year was spent on TV, nearly double TV’s global share of 33.3%. TV spend in the sector rose 1.0% year-on-year to $16.5bn in 2018 but has dipped by 3.7% each year since 2013 on a compound basis. Print also accounts for a greater share of food adspend than is the case globally, with newspapers’ (-2.6pp) and magazines’ (-2.1pp) share dipping mildly over the last five years.


    Retail

    :: Total global adspend in 2018: $62.3bn (+0.0% year-on-year)

    :: Median revenue ROI for successful campaigns: 4.40

    :: Media spend: Internet $21.5bn (+9.1% year-on-year). TV $20.3bn (-0.6%). Print $9.6bn (-15.5%). Other $10.9bn (+0.8%)

    :: Ad/sales ratios: Retail 2.3%. Clothing & fashion (2.9%). Restaurants (2.0%). Supermarkets (1.2%).


    Global advertising spend in the retail sector was flat in 2018 at $62.3bn. The $1.8bn in extra internet spend (up 9.1% from 2017) was offset by a decline in spend for all other media bar out of home (+12.7%) and cinema (+4.9%). Ad investment among the retail sector has tracked downwards in recent years, recording a compound annual growth rate of -1.8% since 2013. However, online advertising has become far more valuable to the sector during this time.


    Soft drinks

    :: Total global adspend in 2018: $15.1bn (+1.1% year-on-year)

    :: Median revenue ROI for successful campaigns: 2.84

    :: Media spend: TV $10.5bn (+1.1% year-on-year). Internet $1.9bn (+28.3%). OOH $1.3bn (-24.1%). Other $1.4bn (+1.3%)

    :: Ad/sales ratios: Soft drinks (5.9%). Bottled water (5.9%). Carbonated (5.9%).


    At 70.0%, TV’s share of soft drinks brands’ adspend is higher than all other categories studied for the report. The $10.5bn spent on TV ads in 2018 was up 1.1% from 2017

    and has grown at a compound rate of 2.0% each year since 2013 – bucking the global trend. However, investment in other media – chiefly internet – has eroded TV’s share of sector spend by 4.4pp over the five years to 2018. Internet formats still draw a relatively small amount of investment, at 12.8%; this is almost three times less than the global level and is likely a reflection of how little e-commerce has disrupted the sector.


    Toiletries & cosmetics

    :: Total global adspend in 2018: $25.7bn (-3.6% year-on-year)

    :: Median revenue ROI for successful campaigns: 2.06

    :: Media spend: TV $14.9bn (-3.9% year-on-year). Internet $5.6bn (+9.7%). Print $2.9bn (-12.0%). Other $2.3bn (-15.9%)

    :: Ad/sales ratios: Toiletries & costmetics (16.9%). Bath toiletries & soaps (12.3%). Fragrances (21.5%).


    At a top line level, ad investment within the toiletries & cosmetics sector has dipped 4.1% each year since 2013 on a compound basis, to a total of $25.7bn last year. This is largely due to how this spend has been allocated historically: in 2013, TV accounted for two-thirds of adspend while print drew a further fifth. Both of these media have recorded declining spend over the period, with internet (+10.7pp) and out of home (+4.7pp) gaining most in share but from a low base -depressing total investment growth in recent years. Print still accounts for 11.4% of sector spend, with magazines alone worth over $2bn, but this total has more than halved since 2013.


  • WARC Global Advertising Trends – TV at a crossroads


    By A Correspondent


    Linear TV, inclusive of real time and catch up viewing, remains by far the top medium for global display advertising spend, attracting over $140bn ad investment in 2018 – more than double mobile internet in second place on $58bn.

    Linear TV’s core strength is reach, and whilst daily viewing time has fallen worldwide in recent years – coinciding with the steady rise in internet penetration – advertiser demand has not diminished.

    As the industry looks ahead, despite the challenges, addressable TV – the ability to show different ads to different households based on consumer data – may be where future growth lies.


    TV continues to dominate global display adspend but its share is falling

    Linear TV is estimated to have accounted for 41.9% of the total display advertising investment this year, or $140bn, in WARC’s 12 key markets -Australia, Brazil, Canada, China, France, Germany, India, Italy, Japan, Russia, UK and US. This represents a rise in spend of 1.0% from 2017 and a share 25.1 percentage points (pp) ahead of the second-largest display medium, mobile internet.

    However, linear TV’s dominating position has been eroding since 2009, mostly at the expense of mobile, which has grown 16.6pp since then.


    TV’s reach is unparalleled, making it high in demand from advertisers despite viewing times decreasing

    TV’s core strength is reach, and its function to facilitate top-of-funnel building, which it does far more effectively than other media, especially over the long-term. Data collated by The Global TV Group from national monitoring organisations show that TV reaches 96% of individuals in key markets each month, and 71% each day on average.

    But daily time spent viewing linear TV has fallen worldwide in recent years – it registered one hour 54 minutes during the first half of 2018, down four minutes from 2017 and 21 minutes from 2012 – coinciding with a steady rise in internet penetration.

    The decline in linear viewing has not, however, led to a reduction in advertiser demand. This has driven up spot cost-per-thousand (CPM) in all key markets this year, ranging from rises of 14% in India, 4% in the US, 2% in the UK to 1% in Japan.


    TV takes almost two-thirds of brands’ successful, high-budget campaigns

    WARC’s Media Allocation Report, which draws from campaign data from over 15,000 case studies, shows that successful, high-budget campaigns invest more in TV while the proportion of budget allocated to digital decreases. Globally, successful brands in the alcoholic drinks and financial services sectors are the biggest spenders on TV.

    In the UK, research has shown that, in the long-term (over three years), TV advertising is responsible for 71% of total ad-generated profit and in the short-term (three to six months), TV ads are responsible for 62%. In both cases, TV accounts for the largest share of profit when compared to other media.


    TV’s effectiveness is undervalued

    Despite research by the Advertising Research Foundation (ARF) showing that sales returns dip $3 for every $1 reduction in TV advertising, and data from Ebiquity showing that TV ranks as the #1 most effective ad medium, 32% of brands responding to WARC’s recent Marketer’s Toolkit survey stated they intend to cut TV investment in 2019. Just under half (49%) intend to retain current levels of investment, while only 18% plan to increase TV spend.


    Addressable TV will bring new challenges to the planning process

    Smart and connected TV penetration reached 35.2% worldwide in 2018, paving the way for forays into addressable TV.

    Whilst still in its infancy, addressable TV technology gives advertisers the ability to leverage user data to combine TV’s reach with an expanded relationship to sales and lower-funnel KPIs.

    But research shows that US viewers are largely unwilling for their personal data to be collected to facilitate such advertisements. Other concerns include measuring addressable TV’s ROI accurately, and brands will need to weigh the benefits of its efficiency and frequency against increased media and creative costs.

    James McDonald, Data Editor, WARC, summing up, says: “TV is a stalwart of the advertising industry, used to deliver effective brand building campaigns with positive ROI to a mass, engaged audience.

    Addressable TV will be the next stage of evolution, though the $1bn spent worldwide this year is a fraction of total TV investment. As live TV still accounts for the majority of daily video consumption, the lure for advertisers is leveraging consumer data to get the right message in front of the right people at the right time.”


    Global media analysis: A round-up of TV
    :: 10.0% addressable share of TV ad impacts by 2022
    :: 41.9% TV’s share of global display advertising spend
    :: 56.4% live TV’s share of total daily video viewing in the UK
    :: 61.5% US consumers unwilling to have their personal data collected for more relevant TV advertising
    :: 62.0% TV’s allocation in successful high-budget (10m+) campaigns
    :: 71.0% proportion of long-term advertising-generated profit by TV

  • 65% of digital media to be programmatic in 2019


    By A Correspondent


    Sixty-five per cent of all money spent on advertising in digital media in 2019 will be traded programmatically, according to Zenith’s Programmatic Marketing Forecasts, published today. Advertisers will spend US$84bn programmatically next year, up from US$70bn this year, which represents 62% of digital media expenditure. We predict that in 2020 advertisers will spend US$98bn on programmatic advertising, representing 68% of their expenditure on digital media advertising. By digital media we mean all forms of paid-for advertising within online content, including online video and social media, but excluding paid search and classified advertising.


    The breadth of ad formats available through programmatic trading is improving, with more mobile, video and audio formats coming online all the time, though brands and agencies need to do more to push publishers to improve the quality of their inventory, which needs at minimum to be safe and viewable.


    Growth in programmatic advertising is slowing as it cements its position as the most important method of digital trading. We estimate that programmatic adspend will grow 24% in 2018, down from 32% growth in 2017, and forecast 19% growth in 2019, followed by 17% growth in 2020.


    In dollar terms, the biggest programmatic market is the US, where we expect US$40.6bn to be spent programmatically in 2018 – 58% of the total. China is in a distant second place, spending US$7.9bn on programmatic advertising this year, followed by the UK, with US$5.6bn of programmatic adspend.


    The US is also the market that has most embraced programmatic advertising, trading 83% of all digital media programmatically this year. Canada is in second place, trading 82% of digital media programmatically, followed by the UK, with 76%, and Denmark, with 75%. By 2020, programmatic advertising will account for more than 80% of digital media in all four markets. Canada will have almost completed the transition to pure programmatic trading, spending 99% of digital media programmatically that year.


    We expect all markets to follow Canada and use programmatic trading for all digital media transactions eventually. Indeed, it’s only a matter of time before programmatic trading becomes the default method of trading for all media. However, the transition is taking slightly longer than we expected – last year we forecast that 64% of digital media would be programmatic in 2018, and 67% would be programmatic in 2019, so we have pulled back both forecasts by two percentage points. The introduction of privacy legislation such as the EU’s GDPR has had some chilling effect by making certain data previously used in programmatic transactions unavailable, and making other data more costly to process. But we think the main reason for the slowdown in spending on programmatic media is that advertisers are investing more in infrastructure and data to make their programmatic activity more effective.


    To make the most of their programmatic campaigns, advertisers have to reorganise internally to give programmatic trading the high-level support and understanding it needs. Agencies can only extract maximum effectiveness from their programmatic strategy in a proper partnership with their clients. And a programmatic strategy can only ever be as effective as the data used to execute it.


    “Programmatic trading improves efficiency and effectiveness, and is gaining a dominant share of digital media transactions,” said Benoit Cacheux, Zenith’s Global Head of Digital and Innovation. “The scale of operational restructuring to make the most of it is both extensive and expensive, though, and advertisers are spending more carefully while they invest in infrastructure and data and review the quality of media. All programmatic advertisers need a strategy for acquiring the best and most comprehensive data available, and to treat this data as a vital corporate asset.”


    The most valuable data is first-party data, either explicitly provided by consumers or gained by tracking their activity on owned websites. It is also becoming more common to use second-party data, by forming data sharing partnerships, between – for example – brands and online retailers. Third-party data is widely available but does not give advertisers a competitive advantages, since all advertising can use it to target the same segments. Advertisers should continually vet and interrogate third-party data to ensure they are truly adding incremental reach. By combining all this data with their own CRM systems, advertisers can model consumer behaviour, and the more advanced are using machine learning to predict it. Data and new technology is enabling brands to move from tracking cookies to communicating with individuals.


    “Technology is making programmatic advertising work harder for brands,” said Jonathan Barnard, Zenith’s Head of Forecasting and Director of Global Intelligence. “Artificial intelligence promises to unlock new understanding of customers as people, as well as improving the optimisation of the trading process.”