AAAI MEMBER AGENCIES
INS MEMBERS
IBF MEMBERS
MINISTRY OF INFORMATION AND BROADCASTING
AROI MEMBERS
IAMAI COUNCIL
AAAI MEMBER AGENCIES
INS MEMBERS
IBF MEMBERS
MINISTRY OF INFORMATION AND BROADCASTING
AROI MEMBERS
IAMAI COUNCIL
By A Correspondent
 Okay, it would be incorrect to suggest that a streetfight is on. But in what is decidedly not a common sight post the release of readership data, news daily dna, has put on a front-page unsigned note headlined: dna questions new IRS numbers.
This is what the note says:
“The Indian Readership Survey (IRS) 2013 is out in the public domain. However, dna contests the data presented by Media Research Users Council (MRUC).
There’s a clear mismatch between the survey figures and our own database. dna has a robust subscription base and we have the names, contact numbers and addresses of most of our readers, who have opted for a paid subscription scheme. This also shows our loyal reader base, which is extremely stable.
We would, therefore, like to know the basis of IRS’ readings. There seems to be an honest error on the part of MRUC and we have written to the Director-General and the Chairman of the Technical Committee of MRUC for a clarification.
We trust the IRS would take corrective measures immediately”
A senior media researcher who spoke to MxMIndia on anonymity said it was indeed unusual for a newspaper to frontpage its peeve on the readership numbers. “The stakes are high in a market like Mumbai, so dna could ill-afford a negative outlook.” But is the paper right in feeling aggrieved, we asked. “Everyone is right in feeling so. While there will be shifts in previous numbers when a research methodology changes, such a significant change is inexplicable.”
Meanwhile, even though the fight hasn’t commenced, the knives are out for sure. And as we know from the past, the Zee group, of which dna is now an integral part, is known to put up a good fight.

Professional networking platform LinkedIn has conducted a study of Tech and Non –Tech Marketers in India and globally (link)..
The survey sheds light on their main challenges in marketing for both tech and non-tech marketers. It also enlists the techniques each type is most engaged in and considers important. It was also found that76% Indian tech marketers go to social professional networks for marketing information, this is higher than the global average of 73%.
We aren’t very sure if LinkedIn is so high on the reading and reference list of marketers, but then that’s what the survey says.
Please refer to pdf here for the study.
Zenith predicts global ad expenditure will grow 4.1% in 2018, reaching US$578 billion by the end of the year. This forecast is fractionally below the 4.2% rate we predicted for 2018 in September, with marginal downgrades in North America, Western Europe and Asia Pacific, and upgrades in Latin America and Central & Eastern Europe.
We expect advertising expenditure to grow more slowly that the global economy as a whole out to 2020.
Growth of advertising expenditure and GDP 2017-2020 (%)

Source: Zenith/IMF
Forecast by regional bloc
We regularly examine the growth rates of different regional blocs defined by the similarity of the performance of their ad markets as well as their geographical proximity. This captures the behaviour of different regional ad markets more effectively than looking at regions defined purely by geography, such as Western Europe, Central & Eastern Europe and Asia Pacific. See the end of the Executive Summary for a complete list of countries by bloc.

Growth in adspend by regional bloc 2017-2018 (%)
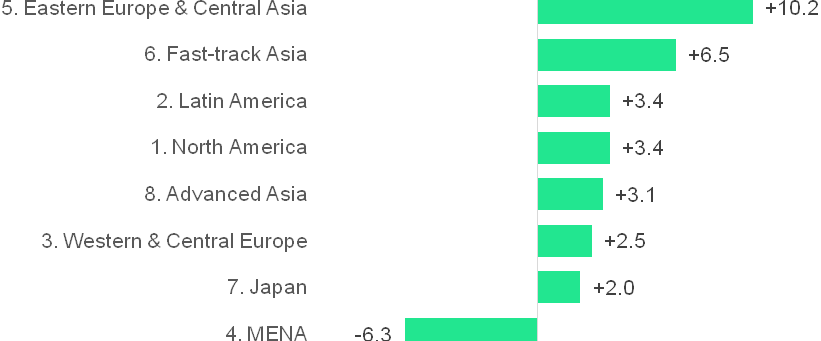
Source: Zenith
North America was the first region to suffer the effects of the financial crisis, but it was also quick to recover, and adspend in North America was more robust than in Western & Central Europe between 2012 and 2014. This changed in 2015 as the European markets most affected by the eurozone crisis recovered rapidly, while declining network television ratings eroded US adspend growth. North America started outperforming Western & Central Europe again in 2016 as political and economic uncertainty in the UK dragged down growth in the latter, and Canada’s healthy economy boosted its ad market. We expect North American adspend to grow 3.4% in 2018, and forecast an average of 3.2% growth a year to 2020.
Argentina, Brazil, Ecuador and Venezuela (which account for 64% of Latin American advertising expenditure) were in recession in 2016, compounded by rapid devaluation in Argentina and full-blown crisis in Venezuela, which is running out of basic supplies and is heading for hyperinflation. Adspend in Latin America shrank by 0.6% in 2016, after growing 7.8% in 2015. Argentina and Brazil are now out of recession, and Venezuela’s sustained collapse in adspend means that its continued decline weighs less on the regional total each year. We forecast 2.8% growth in Latin America adspend this year, 3.4% next year, and 4.4% average annual growth to 2020.
Western & Central Europe was one of the regions most affected by the financial crisis of 2008-2009, which then turned into the eurozone crisis. The eurozone crisis is not definitively over, but the region’s ad market has been enjoying solid recovery since 2014, after which adspend grew at about 4% a year.
The UK was the stand-out growth market in Western & Central Europe from 2011 to 2016, growing at an average of 7.3% a year. However, a slowing economy, gathering inflation, and political uncertainty over the mid-year elections and Brexit negotiations have all contributed to a sharp slowdown in UK adspend this year, which we expect to grow just 0.7% across 2017. And although the eurozone economy has strengthened this year, this has not yet fed through to advertising. We estimate that adspend will have risen just 1.3% in the eurozone by the end of 2017, before accelerating to 2.5% growth in 2018. We now forecast 1.7% growth in Western & Central European adspend this year, down from 3.9% growth in 2016. But we think this will be a low point, and expect anannual average of 3.0% growth to 2020.
The drop in oil prices in 2014 has had a severe effect on the economies in MENA, and has prompted advertisers to cut back their budgets in anticipation of lower consumer demand. Political turmoil and conflict have worsened, further shaking advertisers’ confidence in the region. We forecast an 18.6% drop in adspend in MENA this year, following 10.0% decline in 2016. The region’s decline should moderate in 2018 and 2019, and we forecast very modest 0.4% growth in 2020.
Ad markets in Eastern European & Central Asia generally recovered quickly after the 2009 downturn and then continued their healthy pace of growth for the next few years. In 2014, though, the conflict in Ukraine severely disrupted the domestic ad market, while Russia suffered from sanctions imposed by the US and the EU, the sanctions it imposed in response, and a withdrawal of international investment. These shocks were exacerbated by a sharp drop in the price of oil – which accounted for 70% of Russia’s exports in 2014 – and devaluation of the Ukrainian and Russian currencies.
Adspend shrunk 0.2% in Eastern Europe & Central Asia in 2014, and by 8.8% in 2015. The worst-affected ad markets began to recover in 2016, however, and this recovery has continued in 2017, consistently outperforming expectations. We now think adspend will be up 11.1% in 2017, after which growth will settle down to a more normal 8.9% a year to 2020, ensuring that Eastern Europe & Central Asia remains the fastest-growing regional bloc over this period.
Fast-track Asia is characterised by economies that are growing extremely rapidly as they adopt Western technology and practices and innovate new ones, while benefiting from the rapid inflow of funds from investors hoping to tap into this growth. Fast-track Asia barely noticed the 2009 downturn (ad expenditure grew by 7.8% that year) and since then has grown very strongly, ending 2016 up an estimated 9.0%. However, the Chinese economy – the main engine of growth in Fast-track Asia – is slowing down after years of blistering growth, and the ad market is slowing alongside it. The extended period of mourning for King Bhumibol Adulyadej has led to a second year of decline for Thailand, and Malaysia’s recovery from the downturn of 2016 has been less rapid than we hoped. We expect ad expenditure in Fast-track Asia to grow 7.6% in 2017, and at an average rate of 6.4% a year between 2017 and 2020. This is less rapid than the growth in Eastern Europe and Central Asia, but Fast-track Asia is ten times larger, so contributes a lot more to global adspend growth.
Japan behaves differently enough from other markets in Asia to be treated separately. Despite recent measures of economic stimulus, Japan remains stuck in its rut of persistent low growth. We forecast average adspend growth of 2.1% a year between 2017 and 2020, slightly behind the average annual growth rate of 2.4% between 2012 and 2017.
Apart from Japan, there are five countries in Asia with developed economies and advanced ad markets that we have placed in a group called Advanced Asia: Australia, New Zealand, Hong Kong, Singapore and South Korea. Adspend grew here at 5.3% in 2015, the best performance since 2011, but has slipped back to an estimated 1.6% this year. We expect this to be the trough, and forecast 3.1% average annual growth to 2017, fractionally above the 2.9% average growth rate since 2012.
Average annual growth in adspend by regional bloc 2017-2020 (%)
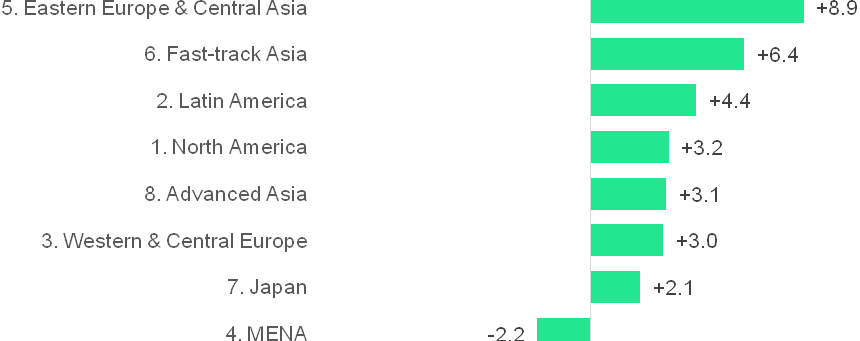
Source: Zenith
Of the various blocs, MENA is the clear underperformer, while the clear outperformers are Fast-track Asia and Eastern Europe & Central Asia. The other blocs range gradually from growing slowly (Japan) to solidly (Latin America).
Forecast by leading advertising markets
The US will be the leading contributor of new ad dollars to the global market over the next three years, making up in scale what it lacks in speed. China will come second, combining large scale and rapid growth (though its growth is slowing as its scale increases).
Between 2017 and 2020 we forecast global advertising expenditure to increase by US$72billion in total. The US will contribute 27% of this extra ad expenditure and China will contribute 20%, followed by Indonesia, India, the UK and Japan, which will contribute 4% each.
Five of the ten largest contributors will be Rising Markets* (China, Indonesia, India, Brazil and Russia), and between them they will contribute 33% of new adspend over the next three years. Overall, we forecast Rising Markets to contribute 54% of additional ad expenditure between 2017 and 2020, and to increase their share of the global market from 37% to 39%.
Top ten contributors to adspend growth 2017-2020 (US$m)

Source: Zenith
The world’s top ten advertising markets by size will remain stable between 2017 and 2020, with only one change in the ranking when Indonesia replaces Canada in tenth place in 2019.
Top ten ad markets
US$m, current prices. Currency conversion at 2016 average rates.
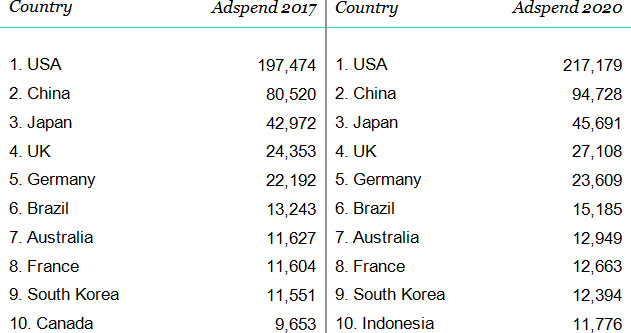
Source: Zenith
Global advertising expenditure by medium
This year internet advertising has overtaken advertising in traditional television to become the world’s biggest advertising medium, accounting for 37.3% of total ad expenditure. As internet advertising matures, its growth is slowing down, but it remains the fastest growing medium by some distance. We estimate that internet adspend grew 13% year on year in 2017, and we forecast an average growth rate of 10% a year between 2017 and 2020. By 2020 we expect internet advertising to account for 44.3% of global adspend.
Internet adspend by type 2017-2020 (US$ billion)

Source: Zenith
Display is the fastest-growing internet sub-category, with 12% annual growth forecast to 2020. Here we include traditional display (such as banners), online video and social media. All three types of display have benefited from the transition to programmatic buying, which allows agencies to target audiences more efficiently and more effectively, with personalised creative. Online video and social media are currently the driving forces of internet adspend growth: we forecast online video advertising to grow by 17% a year on average between 2017 and 2020, while social media will grow by 16% a year. Online video is benefiting from the increasing availability of high-quality content, and improvements to the mobile viewing experience, such as better displays and faster connections. And for many consumers, checking their mobile devices for social media has become a regular, ingrained habit, while social media ads blend seamlessly into their mobile app newsfeeds. Note that these are not mutually exclusive categories: online video ads are now an important component of social media platforms’ revenues.
Paid search and classified are now both lagging substantially behind display. Search is growing at 8% a year, and classified at 7%.
Looking at internet adspend by device reveals the dramatic ascent of mobile advertising (by which we mean all internet ads delivered to smartphones and tablets, whether display, classified or search, and including in-app ads). We estimate that mobile advertising grew 33% in 2017, after 48% growth in 2016, and we forecast an average annual growth rate of 18% a year between 2017 and 2020, driven by the rapid spread of devices and improvements in user experiences. By contrast we forecast desktop internet advertising to shrink at an average rate of 1% a year as advertisers follow consumers to mobile.
We estimate global expenditure on mobile advertising at US$106 billion in 2017, representing 52.2% of internet expenditure and 19.5% of total advertising expenditure (this total excludes a few markets where we don’t have a breakdown by medium). By 2020 we forecast mobile advertising to have grown to US$176 billion, well ahead of desktop’s US$95 billion total, having overtaken desktop in 2017. Mobile will account for 65.0% of internet expenditure and 28.8% of all expenditure in 2020 – more than all the traditional media except television put together.
Share of global adspend by medium
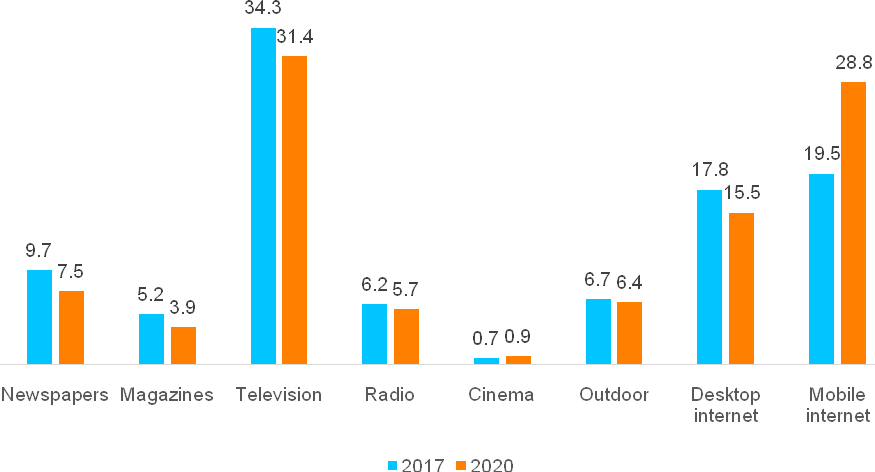
Source: Zenith
Â
Since it began in the mid-1990s, internet advertising (both desktop and mobile) has principally risen at the expense of print. Over the last ten years internet advertising has risen from 9% of total global spend (in 2007) to 37% (in 2017). Meanwhile newspapers’ share of global spend has fallen from 27% to 10%, while magazines’ has fallen from 12% to 5%. Print titles will continue to lose market share as their readers continue to move to online versions of the print brands or other forms of information and entertainment entirely. We predict newspapers and magazines will shrink at average rates of 4% and 6% a year respectively, ending with respective 8% and 4% market shares in 2020.
Note that our figures for newspapers and magazines include only advertising in printed editions of these publications, not on their websites, or in tablet editions or mobile apps, all of which are picked up in our internet category. The performance of print editions does not describe the overall performance of newspaper and magazine publishers.
Television was the dominant advertising medium between 1996 (when it overtook newspapers with a 37% market share) and 2016 (when it attracted 35% of total advertising expenditure). This year, however, the internet overtook television to become the largest advertising medium. Looking at the ad market as a whole, including search and classified, we think television’s share peaked at 39.3% in 2012, fell to 34.3% in 2017, and by 2020 expect it to fall back to 31.4%, its lowest share since 1981.
However, one of the reasons for television’s loss of share is the rapid growth of paid search, which is essentially a direct response channel (together with classified), while television is the pre-eminent brand awareness channel. Television does not compete directly against search, and indeed the two can complement each other, for example by running paid search activity to take advantage of the increase in searches driven by a television campaign. Taking internet classified and search out of the picture, television will remain the principal display medium for many years to come. We estimate television accounted for 42.6% of display expenditure in 2017, and will attract 40.1% in 2020.
If we consider audiovisual advertising as a whole – television plus online video – we see that it is in fact consolidating its dominant share of display advertising. Television offers unparalleled capacity to build reach, while online video offers pinpoint targeting and the potential for personalisation of marketing messages. Both are powerful tools for establishing brand awareness and associations. We estimate that audiovisual advertising accounted for 48.7% of display advertising in 2017, up from 43.7% in 2010, and expect its share to rise to 49.0% in 2020.
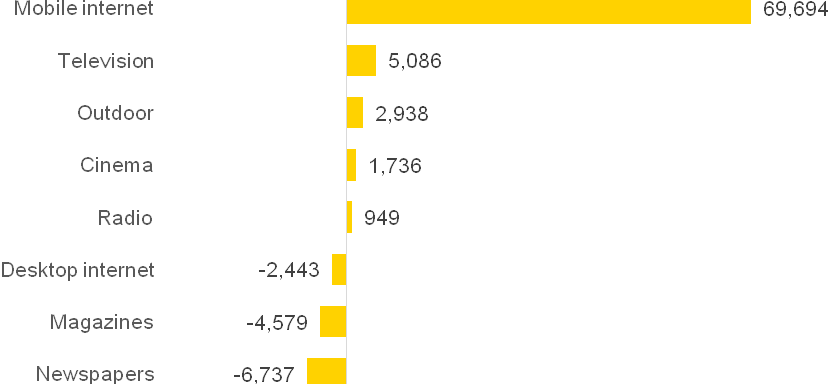
Contribution to global growth in adspend by medium 2017-2020 (US$ million)
Source: Zenith
Mobile is by some distance the main driver of global adspend growth. We forecast mobile to contribute US$70 billion in extra adspend between 2017 and 2020 (again excluding markets where we don’t have a breakdown by medium). Mobile advertising’s growth will be counterbalanced by an US$2 billion decline in desktop advertising, as advertisers switch budgets to mobile, combined with an US$11 billion decline from print. Television and outdoor advertising will be the second and third-largest contributors, growing respectively by US$5 billion and US$3 billion, while cinema and radio grow by about US$2 billion and US$1 billion respectively.
Appendix
List of countries included in the regional blocs
North America: Canada, USA
Western & Central Europe: Austria, Belgium, Bosnia & Herzegovina, Croatia, Czech Republic, Denmark, Finland, France, Germany, Greece, Hungary, Ireland, Italy, Netherlands, Norway, Poland, Portugal, Romania, Serbia, Slovakia, Slovenia, Spain, Sweden, Switzerland, UK
Eastern Europe & Central Asia: Armenia, Azerbaijan, Belarus, Bulgaria, Estonia, Georgia, Kazakhstan, Latvia, Lithuania, Moldova, Russia, Turkey, Ukraine, Uzbekistan
Japan
Advanced Asia: Australia, Hong Kong, New Zealand, Singapore, South Korea
Fast-track Asia: China, India, Indonesia, Malaysia, Pakistan, Philippines, Taiwan, Thailand, Vietnam
Latin America: Argentina, Brazil, Chile, Colombia, Costa Rica, Ecuador, El Salvador, Mexico, Panama, Peru, Puerto Rico, Uruguay, Venezuela
Middle East & North Africa: Bahrain, Egypt, Israel, Kuwait, Oman, Qatar, Saudi Arabia, UAE
*We define Mature Markets as North America, Western Europe and Japan, and Rising Markets as everywhere else
Advertising Expenditure Forecasts is published quarterly priced £495, or £1,485 for an annual subscription. It may be ordered in hard or soft copy from www.zenithmedia.com

By A Correspondent
By now, we have published several forecasts for adspends for calendar year 2018 and thereafter. And here’s another from Media Partners Asia (MPA), a leading research and consulting firm specialising in media and entertainment. Accroding to a new report from the MPA, advertising revenue across Asia Pacific expanded by 6.1% in 2017 to reach ~US$173 billion, and is on course to grow by a further 6.2% in 2018 to move close to US$184 billion this year.
Asia Pacific Advertising Trends 2018 forecasts net adspend after commissions and discounts across 14 major markets in the region. The region’s advertising outlook remains positive with MPA analysts forecasting ad gains in almost all markets in 2018, and ad growth across the board over 2017-22. MPA expects net adspend in APAC to total US$226 billion by 2022, having grown by a 5.5% CAGR from 2017.
“Market momentum for Asia Pacific as a whole should hold steady over 2018 and 2019, but we expect a slight deceleration from 2020 as online advertising, increasingly the main engine of growth across the region, settles into a gentler trajectory in some large ad markets,†remarked Vivek Couto, executive director, Media Partners Asia. “Much of digital’s growth will be driven by China, which should retain more than 60% of online advertising in Asia Pacific over our forecast period.â€
Added Couto: “Traditional TV advertising is now in or on the verge of decline in most countries, having peaked at US$54 billion across the region in 2017. That said, India, Indonesia, the Philippines and Thailand are notable exceptions, underscoring the ongoing importance of mass-market broadcast as a platform for reach and awareness in these growth economies. Overall, TV advertising should contract very slightlyfrom 2017 to 2022, at a -0.1% CAGR. Print advertising, however, is on the retreat almost everywhere, although both newspaper and magazine advertising will continue to grow at a modest single-digit pace in India. Out-of-home, meanwhile, remains on an upward trajectory in most markets, benefiting from ongoing urbanization as well as digital upgrades.â€
Growth Dynamos In China And India
China’s ad market, by far the largest in Asia Pacific, also experienced the highest growth in 2017 with a 9.9% increase taking netspend past US$86 billion, powered by increasingly mobile-centric digital platforms as well as a buoyant economy. MPA projects net advertising in China to expand by a healthy 6.9% CAGR from 2017 to surpass US$120 billion by 2022, supported by solid consumer fundamentals and macroeconomic growth. Online platforms dominate with a 56% share of China’s ad market in 2017. This slice should grow to 68% by 2022, an 11.3% CAGR, according to MPA.
Ad growth in India – a contender for Asia’s most dynamic market – was weighed down in 2017 by the lingering effects of demonetisation as well as a new goods and services tax, which disrupted advertiser supply chains, inhibiting marketing activity in the process. Net ad spend consequently grew by 6.9% in 2017 to total US$9.0 bil., ending three successive years of double-digit growth. Nonetheless, India should re-emerge as APAC’s fastest growing ad market over the next five years. MPA analysts forecast a 10.9% CAGR in net ad spend in India from 2017 to total US$15 billion by 2022.
This pace just eclipses the Philippines, Asia’s second-fastest growing major ad market over the next five years with a 10.8% CAGR according to MPA. Thailand’s ad market, showing signs of emerging from a prolonged malaise, is on course to grow by an 8.0% CAGR from 2017-22, making it the region’s third fastest growing ad market over the next five years, with China ranked fourth.
While the overall rate of advertising growth for APAC is slowing, a mixed picture emerges on the ground. Ad spending over 2017-22 should pick up speed compared with 2012-17 in Australia, Hong Kong, Malaysia, the Philippines, Singapore and Thailand. At the same time, cornerstone markets such as India, Indonesia and Japan should be able to sustain the pace they have set over the past five years. Other territories, however, are entering a slower growth cycle. Five markets will see less than a 2.0% CAGR from 2017-22: New Zealand (1.9%), Malaysia (1.8%), Taiwan (1.7%), Korea (1.4%) and Singapore (1.0%).
Internet Trends Become Market Trends
The pattern of ad growth across Asia Pacific is becoming increasingly determined by online media, which will soak up the vast majority of new ad dollars in the region for the foreseeable future. MPA estimates that internet advertising in APAC grew by 18.1% in 2017 to nudge past US$76 billion, with a projected 14.4% growth in 2018 taking the total to US$87 billion this year. The overall CAGR for internet ad spend between 2017 and 2022 should slow to 11.1% (10.8% ex-China), although the pace of growth from a low base in India, the Philippines and Vietnam should still top 20%. Online ad spend already accounted for more than half the market in Australia (51%) and China (56%) in 2017. Taiwan is forecast to cross the half-way mark in 2019, while New Zealand should follow suit somewhere around 2020.
Online video advertising meanwhile is entering into a red-hot growth phase, powered by the rising prominence of high-speed broadband. MPA forecasts that by 2022, online video platforms will contribute at least 10% of all advertising in nine markets: Australia, China, Hong Kong, Indonesia, Malaysia, New Zealand, Singapore, Taiwan and Vietnam, compared with just one market (Taiwan) in 2017. At the same time, online video spend will be near TV’s share in Australia and China, two big internet markets, over the same time-frame, with Hong Kong and New Zealand not far behind.
About Asia Pacific Advertising Trends
Asia Pacific Advertising Trends, published annually by Media Partners Asia (MPA), contains detailed analysis of media across 14 markets in Asia Pacific. Key metrics include: historical and projected data (2012 to 2022); net advertising revenues across TV, internet (including local and global online video platforms), print (newspapers and magazines), out-of-home, radio and cinema; macroeconomic analysis and impact; and analysis of key drivers and challenges by market. Market coverage comprises: Australia, China, Hong Kong, India, Indonesia, Japan, Korea, Malaysia, New Zealand, the Philippines, Singapore, Taiwan, Thailand and Vietnam.

Ernst & Young’s Global Media & Entertainment Sector has identified and assessed the Top 10 areas of upside and risk for the industry. The firm asked two questions; What are the most significant growth opportunities for media and entertainment companies today? What are the most significant risks or threats that they face? Here are the takeaways, in brief.
Evolving the business model
As the pace of disruption accelerates, Media & Entertainment companies must rapidly revamp product and service offerings, distribution frameworks and pricing/ monetisation strategies to meet shifting customer expectations.
Adapting the enterprise to new realities
Media & Entertainment companies require a new level of operational excellence — the type of performance improvement and strategic expense reduction that delivers short term results and long term efficiencies.
Enabling new advertising currencies
As advertisers gain a keener understanding of their target consumers, new currencies, which blur the lines between linear and digital media are emerging, even as audience measurement across platforms continues to challenge the industry.
Engaging customers in new experiences
Just a few years ago, consumers were delighted to be able to stream a movie or TV show on multiple devices. Now, consumers expect personalized experiences across their daily lives.
Mitigating against cyber risks
Every click, view and download results in massive amounts of data being created every day. This data offers Media & Entertainment companies a real competitive advantage, however, the same data is a magnet for cyber-criminals.
Battling for the best content
Ever-rising investment in content is tipping the scales of corporate performance both ways — translating into either strong growth or painful margin pressures.
Building scale, both horizontal and vertical
Media & Entertainment executives see inorganic routes as the fastest way to fill gaps in their portfolios, re-set their strategic positioning in the industry and future proof their business models.
Accelerating the marketplace
As new technologies accelerate how supply and demand intersect, the dynamics of media marketplaces — for both consumers and advertisers — are becoming super fluid, placing new pressures on all parts of the ecosystem to move more quickly.
Reinventing the tax model
US tax reform represents the biggest change in taxation for over thirty years and yet it is really an inflection point in what has become a much wider conversation about the future of the tax function.
Making multinational matter
Finding the optimal business model, strategy and ownership structure to achieve success in international markets requires nuance and flexibility.
By A Correspondent

Ashish Bhasin, Chairman and CEO – South Asia, Dentsu Aegis Network and President of the AAAI and Pratap Pawar, Chairman, Sakal Media Group, will continue in their respective roles as Chairman and Vice Chairman of Media Research Users Council (MRUC), until the next AGM. This was decided last week after the AGM.
Said Bhasin: “After the successful launch of IRS 2017, our aim is to release the IRS more frequently and strengthen the focus on MRUC’s core objective of offering Media Research that goes beyond the flagship study IRS.â€

Added Pawar: “We thank all our members for their continuous support to the MRUC in ensuring the success of IRS 2017. We will carry the momentum forward and ensure the users of IRS do not have to wait long for the next launch of IRS.â€
By A Correspondent
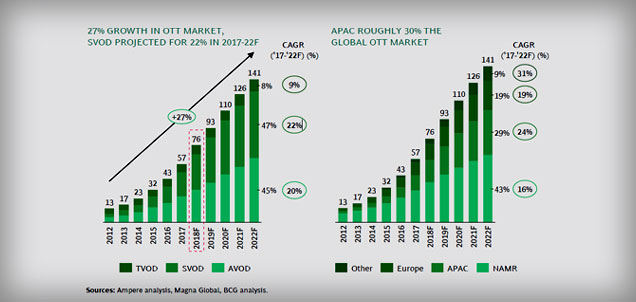
Over-the-top (OTT) content market in India is at an inflection point in India, as per the latest report by The Boston Consulting Group titled ‘Entertainment Goes Online’.
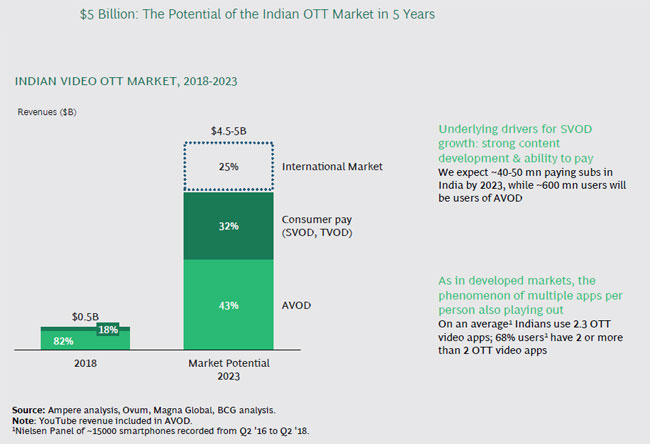
The report pegs the Indian OTT market to reach $5bn in size by 2023. This growth is being driven by rising affluence, increase in penetration of data into rural markets and adoption across demographic segments including women and older generations.
The ‘Entertainment Goes Online’ report is based on a consumer survey that seeks to understand consumers’ motivations in adopting OTT content over other conventional modes of content delivery. Survey results showed that there is a room for many types of OTT models such as SVOD (subscription-based platforms), AVOD (advertising-based platforms) and TVOD (transaction-based platforms) to succeed in the market.
Said Kanchan Samtani, Partner & Director, The Boston Consulting Group: “Majority of India has a single TV per household. Affordable data has created an alternate medium where consumers, for the first time, can tap into content basis individual preference at a time and space convenient for them. Whilst the current market operates with a largely advertising paid content paradigm, consumers are not averse to paying for convenient content access that OTT unlocks.†Affluence and wide variety of content being developed for OTT market including diversity in genres and language gives OTT market a favorable edge over it traditional counterparts.
The study identified three archetypes of customers in the Indian market, 1) traditionalists – who primarily consume on other than OTT platforms, 2) OTT Experimenter – who has significant consumption on both conventional and OTT platforms 3) Early Adopter – whose primary consumption occurs on OTT platforms. While early adopters are still a more urban phenomenon, going forward it will be more equally distributed.
As many as 48% of India’s internet users (~650 million by 2023) are expected to be from rural areas. With development of regional content by various players, the rural market is poised to become a significantly large opportunity for players. OTT is riding the wave of increased data consumption and internet access in rural India, has opened a new distribution channel that is viable for regional and niche content.
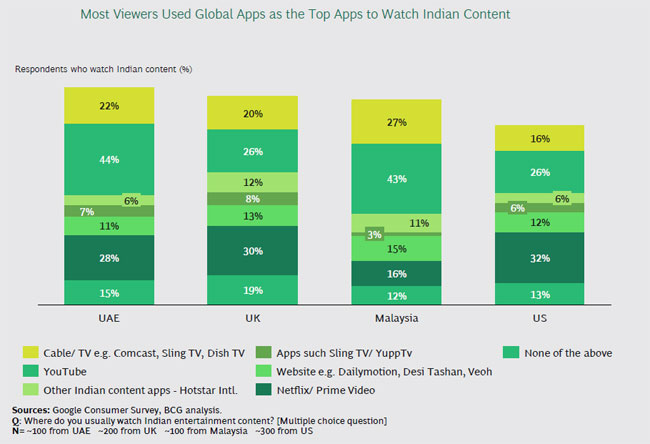
Indian content including music, Bollywood content and cricket have large following in the Indian diaspora also. OTT Players with Indian content have potential to tap into this market too. “While the NRI content market is huge and demonstrates willingness to pay, it is not only dominated by cricket – Bollywood music and films are very significant. With their large content libraries, Indian OTT players are sitting on a metaphorical gold mine to serve this increasingly important customer baseâ€, said Gaurav Jindal, Principal, The Boston Consulting Group.
“One of the key insights of our consumer work was that, while OTTs rely on top-notch hero content to attract consumers to the platform, the stickiness of these consumers is not very high unless accompanied by ways in which they engage more deeply with the platform and is associated with strong marketing efforts,” added  Samtani when discussing the subscriber acquisition and retention strategy of various OTT platforms.
While Indian OTT players have taken many steps to capture the market, there is a lot that needs to be done before, Indian OTT market achieves the same penetration and maturity as its western counterparts.
The report mentions Top 6 priority focus areas to drive the agenda for OTT players which can be read here.

By A Correspondent
ESP Properties, the entertainment and sports division of GroupM, released the 2019 report on sports sponsorship in India. According to the report, overall, sports sponsorship saw a healthy growth of 12% in 2018. Sports advertising grew to Rs 7762 crores.
Cricket has gained the ground as IPL hit a maximum. While an overall level of the growth of on-ground sponsorship was 20%, cricket witnessed a momentous upsurge of 34% with IPL Central Sponsorship contributed to revenue of more than INR 600+ Cr ($88+ Mn) in 2018. IPL franchise fee, amounting to approximately INR 291 Cr ($43Mn), ceased to be valid in 2018 rendering a year-on-year comparison irrelevant in that area, netting off this difference, contributing to the 12% growth.

Said Vinit Karnik – Business Head, ESP Properties: “2018 was a spectacular year for the business of sports and 2019 will be another power-packed year. There will be a significant rise in sports leagues and tournaments since IPL has inspired other sports leagues such as PKL, ISL, and PBL. From the IPL team sponsorship seeing a growth of 20% or for the first time ever to Kabaddi registering a growth of 31%, factors like these have given sports sponsorship a boost. With IPL now and ICC Cricket World Cup coming up we also expect sports celebrities to be the talk of the town, monopolizing consumer attention and advertising money.”
The IPL Team Sponsorship tally had a better year, touching INR 300 Cr ($44Mn) for the first time ever saw a growth of a significant 20%. IPL also plays the star act on TV as digital moves up the ladder. 85% of all ad expenditures in sports happened on TV in 2018. Digital grew at 44% as it was triggered by Hotstar and Sony Liv and platforms which continued to drive adoption and carved a niche for itself.
Emerging sports too saw positive growth signals. ISL (Indian Super League) over the years had grown into a strong property with a calendar spread over six months. Kabbadi had a good year in 2018, registering a growth of 31% over the previous year in on-ground sponsorship. This was further backed by Odisha government announcing a five-year deal with Hockey India for junior and senior- men and women teams. Year also saw Tata Motors become the principal sponsor of Indian wrestling in the non-cricket team sponsorship.
Also, big money continues to chase the king of chases as cricket widens the lead over the rest of the sports. 2018 saw a 22% growth in Athlete Brand Endorsement Value. Of the INR 482 Cr ($71Mn) spent by brands on sports stars acquisitions, 81% was accounted just by India’s most popular sport. Two cricketers alone, Virat Kohli and MS Dhoni, pulled in 66% of all athlete endorsement monies spent by Indian brands last year. Though Virat Kohli leads from the front touching an endorsement value of approximately INR 200 Cr. Pusarla Sindhu had a momentous 2018 both on and off the court.
La Liga signed a three-year exclusive agreement with Facebook to show all 380 matches to users in India, Afghanistan, Bangladesh, Bhutan, Nepal, the Maldives, Sri Lanka, and Pakistan. With huge digital groundswell behind viewership trends, digital media should grow disproportionately in the future as a wider viewer base will attract more ad revenue.
Based on the events across various leagues, tournaments, sponsorships, and non-sponsorships, 2019 looks like a good year for Cricket and emerging sports, which will give rise to bottomless engagement with brands and sporting fans in India.
By A Correspondent
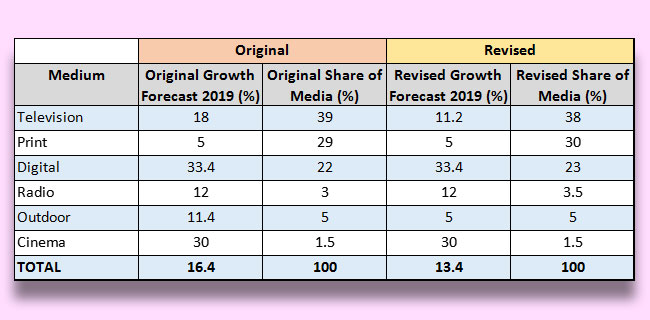
The Pitch Madison Advertising Outlook Report 2019 has revised its forecast for AdEx 2019 downwards, mainly due to a drop in TV Adex in Quarter1 2019. According to the Original Report, released in February 2019 Adex was forecast to grow by 16.4%, but the it has now beeing revised downwards to 13.4%. By medium, the revised forecast stands as follows:
| Original | Revised | |||
| Medium | Original Growth Forecast 2019 (%) | Original Share of Media (%) | Revised Growth Forecast 2019 (%) | Revised Share of Media (%) |
| Television | 18.0 | 39.0 | 11.2 | 38.0 |
| 5.0 | 29.0 | 5.0 | 30.0 | |
| Digital | 33.4 | 22.0 | 33.4 | 23.0 |
| Radio | 12.0 | 3.0 | 12.0 | 3.5 |
| Outdoor | 11.4 | 5.0 | 5.0 | 5.0 |
| Cinema | 30.0 | 1.5 | 30.0 | 1.5 |
| TOTAL | 16.4 | 100.0 | 13.4 | 100.0 |
Whilst there is no change in the growth forecast for Digital, Radio and Cinema, there is a downward revision for Television and Outdoor, which has led to an overall downward forecast of AdEx for 2019. The major reason for the drop in Television AdEx is the drop faced in the first quarter (January – March 2019), because of the NTO order, which caused chaos in the Television market and led BARC to issue an advisory, not to use Ratings because of major changes in availability of channels.
Another major reason that resulted in the drop in Television AdEx was the ill-fated decision of major networks to remove their Free-to-Air (FTA) channels from DD FreeDish. This led to a loss of 275 GRPs per week in the Hindi GEC + Movies market. New FTA channels that emerged could not make up the viewership enjoyed by the established FTA channels like Zee Anmol, Star Utsav, Star Bharat, Sony Pal, Colors Rishtey, etc. A few new FTA channels did emerge like Dangal, Enter 10, etc. but these could not make up the GRP loss. As a result for the first time in many years the first quarter of 2019 saw a de-growth of -5%% in Television Adex. In Quarter2 TV Adex recovered on the back of Parliamentary Elections, IPL and World Cup. We expect Quarter3 also to be reasonably strong on the back of the festive season, but we expect a softening in Quarter4.
The Pitch Madison Advertising Outlook Revised Forecast by Media is as follows:
Rs. in Crores
| Medium | Original Forecast 2019 | Revised Forecast 2019 |
| Television | 27649 | 26050 |
| 20429 | 20429 | |
| Digital | 15612 | 15612 |
| Radio | 2401 | 2401 |
| Outdoor | 3750 | 3533 |
| Cinema | 1047 | 1047 |
| TOTAL | 70888 | 69073 |
Said Sam Balsara, Chairman, Madison World, “It appears that the Consumer is looking for reasons to not spend or delay his spending. At a time like this Advertisers should not lose faith in Advertising, and use it aggressively but effectively to protect their Share.”

By A Correspondent
Adspends in India will grow 12.6% in the year 2020, a slight increase from the 12.4% in the year 2019. This was part of the global ‘This Year Next Year’ report released by GroupM at a global level. It may be noted that GroupM presents its India-specific numbers every year in early February, which can hence be expected two months from now.
According to the numbers released, for India, the growth in television will be 11.1%, whereas for radio it will be 8%. The growth forecast numbers for newspapers and magazines are 1% and -10% respectively. While the growth for outdoor and cinema is pegged at 8.1%, that for internet will be 26.3%.

Said Prasanth Kumar, CEO, GroupM South Asia: In 2020, India faces challenges and uncertainties across sectors, just like other markets. However, this also brings opportunities for brands to innovate. This will be propelled by greater use of technology and better content across media.”
Meanwhile, here’s the rest of the report:
The global economy has weakened in 2019 and will remain similarly soft in 2020. By our calculations, based on Refinitiv data, the gross domestic product (GDP) of the countries we track in “This Year, Next Year” is growing by only +2.6% this year in real (inflation-adjusted) terms.
Growth in 2020 is expected to be similar (+2.5%), with only slightly faster growth (+2.8%) in 2021 and beyond. For reference, +2.5% would be the slowest pace of growth in any non-recession / non-recovery year over the past two decades. In nominal terms (including inflation), 2019 growth for these countries is expected to be +4.9%, down from growth of +5.8% in 2018 and +5.7% in 2017. 2020 looks somewhat similar to 2019, and marginal improvements follow in subsequent years.
Nominal growth rates are important to track because they are the most directly comparable figures to those with which marketers and media owners work in determining their own financial plans.
Personal consumption expenditures are holding up better. One factor that has probably helped sustain marketing growth so far this year is growth in personal consumption expenditures (PCE). As consumer spending represents more than half of all economic activity, PCE can be more important to monitor than GDP. Global growth in nominal PCE is holding up as well in 2019 as it did in 2018 at +5.5% in both years. Growth is expected to slow, but only modestly in the years ahead. Of course, changes in inflation levels diminish these figures, with expectations for real (inflation-adjusted) PCE growth at incrementally slower levels each year over the next five years.
Industrial production often correlates more tightly with advertising growth trends. Industrial production (IP) figures are another key set of metrics to monitor, as IP often correlates better with advertising activity than either GDP or PCE (manufacturers generally only make things for sale if they are planning to spend money on advertising them). Weighted against GDP in the markets captured here, we see pronounced weakness in 2019 and 2020 (+1.2% and +1.5%, respectively) relative to 2017 and 2018 levels (+3.5% and +3.1%, respectively). Recovery toward slightly higher levels is anticipated for 2021 and beyond.

Trade and other factors are key sources of uncertainty. As the Organisation for Economic Co-operation and Development (OECD) has pointed out, slowing global trade is clearly dragging on economic activity, and seemingly heightened geopolitical uncertainties are similarly unhelpful. All of this would worsen if the U.S. experienced a recession, although the U.S. economy has remained resilient, likely aided in part by low interest rates and corporate tax reductions, alongside a federal deficit of nearly $1 trillion during the most recent fiscal year. This was equivalent to more than a quarter of all government expenditures and nearly 5% of the overall economy, or more than double its recent trough in 2015.
Mean and median growth rates may tell different stories. We note the difference between mean and median growth rates, with larger economies expected to perform relatively better than smaller ones in the years ahead.
Global Advertising Growth Summary
In this environment, deceleration in advertising growth should be generally unsurprising. Global advertising, excluding U.S. political advertising (large enough to distort global growth rates by +/-1% each year), expanded by +5.7% in constant currency terms during 2018, capping the third year of better than +5% growth and the best year of the current economic cycle. However, 2019 appears set to grow nearly a percentage point slower at +4.8%, and growth is expected to slow by another percentage point in 2020 and 2021. We forecast +3.9% growth next year and +3.1% growth the following year. Growth is expected to range between +3–4% through 2024. Although much worse than recent years, we note that this would amount to a similar pace of growth to what was observed during 2012–2014. We estimate that the total global advertising market during 2020 will amount to $628 billion as we define advertising here, but would likely approach $700 billion on a broader definition that includes spending on direct mail and directories around the world.
Notably, a substantial share of global advertising is now accounted for by digital-first brands that are endemic to the internet. Based upon their securities filings, we can see that Alibaba, Alphabet, Amazon, Booking.com, eBay, Facebook, IAC, JD.com, Netflix and Uber are each now $1 billion+ advertisers, accounting for $36 billion in spending during 2018, up by a quarter over 2017 levels; growth in 2019 was presumably very similar. Adding a couple dozen companies from the next tier of comparable marketers would easily add tens of billions of dollars of additional activity. Combined, this small group of companies accounts for a majority of the world’s growth in spending on advertising. To the extent that these companies tend to take shares of consumer spending from others and do not directly cause the global economy to expand, at some point their growth converges with global averages, resulting in slowing growth in spending as well.
The median growth rate has exhibited sharper deceleration in 2019 than the mean. For the countries we have tracked with consistent data back to 1999, the median growth rate in 2018 was +5.2%. It is expected that 2019 will be +2.1%, followed by +2.7% growth in 2020, with generally slower growth than the weighted average. The difference between the mean and median highlights that growth is driven by a small number of large countries and that the typical small country is experiencing worse growth trends, bringing down the worldwide average. By contrast, median country growth was typically well above the mean as recently as 2013, reflecting a period where much of global advertising growth was driven by smaller countries. This maps to the aforementioned global economic trends.
The U.S. remains the largest global advertising market, with $246 billion in advertising as we define it here, and growing above global averages. With nearly 40% of the world’s total and a still-robust advertising market in 2020 and beyond (at +4–5% growth excluding directories, direct mail and political advertising), the U.S. is helping raise global averages. Our forecasts anticipate a slowing economy as well as the gradual maturation of the digital brands that have driven so much recent growth. On the basis described here, normalized U.S. advertising should slow from +7.6% in 2019 to +5.0% in 2020, +3.4% in 2021, and similar levels in subsequent years.
China’s $90 billion media market is maturing and beginning to slow, but is still more than two times the size of the number-three market, Japan. After many years of rapid growth, China is now solidly the world’s clear number-two market for advertising, with 16% of total media-owner ad revenue, nearly matching the country’s 17% share of global GDP. However, macroeconomic concerns—including issues referenced above and a general maturation of the Chinese advertising market—are weighing on growth
this year and beyond. We forecast growth of only +3.7% in 2019 and +1.4% in 2020. Similarly, low levels of growth are anticipated in subsequent years despite faster levels of economic expansion for the overall Chinese economy. Japan remains a solid number three, with 7% of global advertising ($41 billion in 2020) and 6% of GDP, but growth is expected to be tepid there as well; +1.7% growth in 2019 is expected to be followed by +1.8% in 2020, and closer to +1% in subsequent years.
The U.K. is still growing at a remarkably fast pace. Among larger advertising economies, the U.K. and the U.S. stand out for their healthy growth expectations. For the U.K., it is a feat made more remarkable given how much uncertainty has persisted over the past three years since the Brexit referendum. Five years ago, the U.K. was essentially tied with Germany as the number-four market for global advertising, but since that time the U.K. has grown by +44% while Germany has only expanded by 7%. The factors driving the U.K. are likely similar to those that have helped make the U.S. a strong market, including a substantial presence of digital brand spending as well as the expanding availability of ad inventory (in digital environments, primarily), which help make it possible for smaller marketers to use media. Although we do expect growth to taper off from the high-single-digit levels we have observed since 2014, solid mid-singles (+6.7% in 2020 and +5.5% in subsequent years) are now expected.
Germany and France are growing at below-global average rates; so is much of the rest of Europe. Brazil should be above average, while India is the world leader among larger media markets. Germany and France have certainly underperformed U.K. and U.S. levels of advertising growth in recent years, but remain in the number-five and number-six positions for now. France appears set to grow at a slightly faster pace than Germany, with a +2.8% five-year compound annual growth rate (CAGR) through 2024 for France versus a +1.6% CAGR for Germany. By 2024, Germany should still be the fifth-largest advertising market, but France will likely be overtaken in importance by both India and Brazil, currently number six and number seven, respectively. Brazil should grow at a solid +4–5% level through 2024 after a soft 2019 (we believe the ad market there grew by only +3.3% in 2019), but India should continue to be stellar, maintaining double-digit growth rates (we estimate +12–13% each year from 2020 to 2024, similar to 2019 levels). Of course, inflation is an issue for both of these countries, negating much of Brazil’s growth. However, in India the effect will only mean that real growth is in high-single digits rather than low doubles.
Canada and Australia are similarly sized markets, but they are growing in different directions. Canada and Australia round out the world’s $10 billion+ ad markets in 2019, with Canada expected to grow slightly faster over the next five years and growth likely largely tied to the health of its southern neighbor. Australia’s trends will likely differ, as we see at the present time with that country’s economy soft and facing a real risk of recession for the first time in decades. The Australian ad market was likely only stable in 2019 versus 2018 and probably grows only slightly in 2020, for a +2.0% gain expected next year. By contrast, Canada is expected to grow +5.0% in 2019, and should slow toward a high 3%+ growth level next year and in subsequent years. Overall around the world, 14 territories are expected to decline during 2019, with Italy the largest among them: We anticipate Italy will fall by -0.4%. Other large markets among this group include Mexico and Switzerland, which are expected to decline by -4.6% and -8.0%, respectively. Next year, fewer markets are expected to decline, with Switzerland the most significant among them
By Indrani Sen
 As per the Pitch Madison Advertising Report, in 2020 adspends in India are predicted to grow by 10.4%, while GroupM’s This Year Next Year predicts that in 2020 the same will grow by 10.9%. This rate of growth is the only aspect on which both the reports have shown some similarity.
Even while commenting on the growth rate, GroupM sounded buoyant by comparing it with the 5.1% growth rate of global ad spends in 2020 and ignoring the Indian ground realities while Madison described the growth rate as “muted” expecting the economy to bounce back only in the second half of 2020.
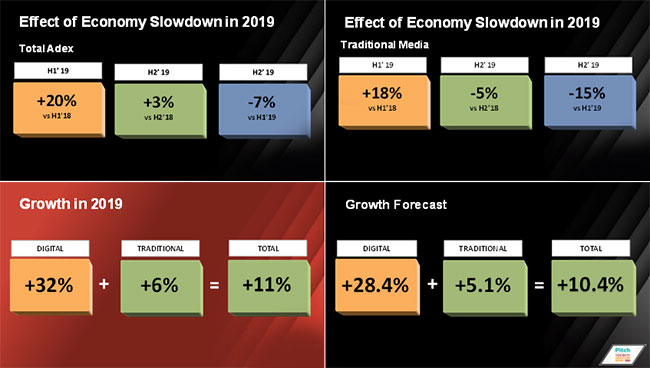
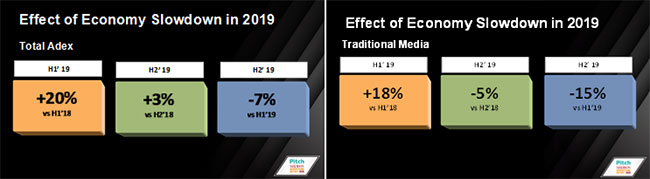
PMAR 2020 is more firmly rooted in the Indian media and market scenario and has presented an excellent analysis of the ups and downs faced by the traditional media industry in 2019 and its consequences. In his presentation, Sam Balsara made an interesting observation by dividing 2019 in two halves and showing how AdEx grew very well during the first half riding on IPL, World Cup and Lok Sabha Elections, but collapsed during the second half due to economic slowdown. Balsara also showed how the traditional media suffered heavily during the second half of 2019, when compared to second half of 2018, there was a de-growth in second half of 2019.
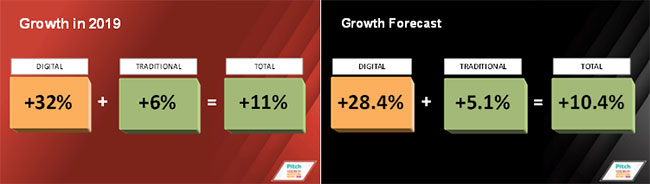
Balsara presented charts showing that the Digital media grew by 32% in 2019 and projected a growth rate of 28.4% in 2020 as against traditional media which grew by 6% in 2019 and is expected to grow by 5.1% in 2020.
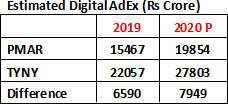
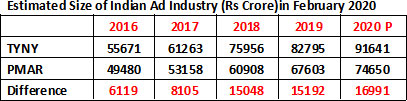
He commented in his presentation that: “We also expect a wide variation of growth rates across mediums ranging from a low of 2% for Press, 5% for Radio, 6% for Outdoor, 7% for TV, to 20% for Cinema and 28% for Digital.” In 2020 TV will continue to enjoy the largest share of the advertising pie at 36% and Print may be demoted to number 3 with Digital securing a march over it. As of now, PMAR predicts 26.6% share for Digital and 27.4% share for Print in 2020. PMAR and TYNY also projects different estimates for the size of the traditional media, with TYNY estimating a value of TV AdEx almost 10000 crore higher than the value estimated by PMAR.
The growth rates for Digital media estimated by TYNY is 28% in 2019 and 26% in 2020. Both the reports predict Digital as the main growth driver of Indian Adex in 2020, but there is again a significant differences between the estimated sizes of Digital AdEx.
GroupM has revised their estimate for total AdEx upwards for both 2018 and 2019 while Madison revised their estimate for total AdEx downwards for 2019 due to economic slowdown and various headwinds faced by the traditional media industry. As a result of these revisions made by the two agencies, estimated sizes of Indian Ad Industry by TYNY are now 15000+ crore higher than the sizes estimated by PMAR, a difference which is not only difficult to reconcile, but also creates confusion in the market place.
By now, we have learned to live with different sizes of the Indian Ad Industry estimated by different agencies. PMAR estimates are most acceptable by the industry at large due to its ability to link the market realities with their statistics supported by analysis of trends in Ad Spends as well as in depth analysis of individual media. Balsara also adds an icing on his presentation every year through advice to advertisers which are considered to be extremely useful and this year he has excelled himself on that score.
Indrani Sen is a veteran advertising and media agency practitioner. She is now also an academician. Her views here are personal