Tag: WARC report

  • 75% marketers expect increase in mobile budgets…


    MMA in collaboration with WARC has unveiled a new report titled ‘The Use of Mobile in Digital Marketing Mix’. The study analyses mobile marketing capabilities, growth in m-commerce and social marketing, and impact of technologies such as AI, IoT, ML & voice on improving marketing efficiency.


    Key highlights include:

    • Two third (69%) marketers have adopted mobile-first approach – a 10% increase since 2020 demonstrating mobile marketing’s growing position in the greater modern marketing picture


    • 55% marketers use engagement metrics followed by business metrics (51%) to measure mobile effectiveness in 2021


    • 75% marketers are expecting an increase in mobile budgets in 2021 – a 20% increase since 2020 led by social media and m-commerce technologies


    • Social media leads in marketers’ (86%) strategy, followed by mobile web display (50%) and in-app display (47%). 56% Indian consumers engage with social media ads – highest amongst any country.


    • 89% respondents agree that mobile plays a significant role in purchase journey. With e-commerce boom, 82% marketers have accelerated their m-commerce capabilities and 81% are embarking on shoppable media which is becoming a business avenue


    • 62% marketers believe that ‘death of cookie’ will significantly impact marketing strategies. Furthermore, ad fraud continues to hinder mobile growth for 33% marketers followed by consumer privacy concerns and metrics (25%)


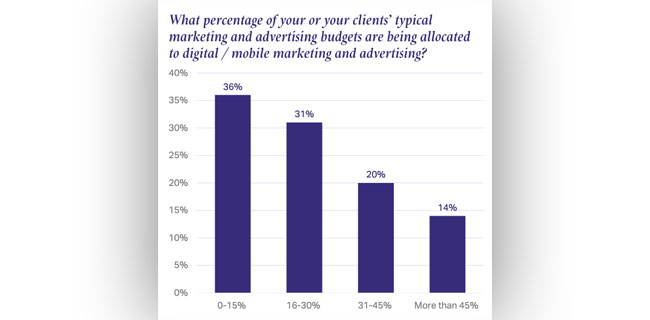
    • Nearly 37% marketers are spending more than a quarter of their budget in martech, while 35% are spending less than 10%


    • With 37% marketers using AI & ML capabilities in 2021 – 42% expect these to be the top technologies over the next two years, followed by IoT (25%) and voice (24%)


    Key Takeaways from the report:

    1. Brand awareness is the most common key objective when running mobile marketing campaigns in India. As for marketing channels, TV and display are considered the most effective channels when run alongside mobile.

    2. Social is the most used and most prioritised channel for mobile marketing. Nearly nine-tenths (86%) of respondents are using social in their mobile marketing strategy. YouTube, LinkedIn and Facebook are the biggest platforms for display marketing, while Twitter and Instagram are dominating partnership and sponsorship marketing.

    3. Marketing professionals in India are expecting mobile budget growth this year. Three in four (75%) are expecting their mobile budget to increase this year. Last year, just over half said the same (55%).

    4. Mobile commerce has been accelerated due to the pandemic. Four in five (82%) marketers have experienced improved m-commerce capabilities and just under half (46%) of Indian marketers have named commerce via mobile devices as the most significant consumer behaviour in 2021.

    5. The cookie-death will have a significant effect on the marketing industry. Even though the end of the thirdparty cookie has been delayed, three in five marketers are predicting an impact to their business from its ‘death’.

    6. The future of mobile technology seeks to connect the online and offline, particularly through AI and machine learning, IoT and voice. Respondents are investing significant budget into mobile martech to ensure they keep up with the latest innovations in the industry, especially as interest in AI grows.

    Click here for the full report

  • Globally, most products are moving adspends online: WARC report


    By A Correspondent


    TV still attracts over two-thirds of advertising investment within the soft drinks sector, while a similar share is seen in the food category – both sectors are far less likely to have been disrupted by e-commerce, so the need for high levels of digital adspend to facilitate a path to purchase is reduced.

    But across all categories, ad investment is shifting heavily into internet formats. The pivot to online advertising is particularly stark within financial services and retail, with both sectors having heavily developed digital platforms to serve their customers in recent years.

    These are some of the findings by WARC, the global authority on advertising and media effectiveness, drawn from an analysis of its newly relaunched WARC Data product, which provides a new industry standard measure of net advertising investment data across 19 product categories in 23 markets, including the United States, United Kingdom and China.


    Said James McDonald, Managing Editor, WARC Data, and author of the research: “In a multichannel world, it has become harder than ever to track campaign performance, measure ROI, or to even trust third-party data. Additionally, the problem is compounded by an environment of ad blocking, fraud, and consumer distrust, and is hazed by walled gardens, programmatic stacks and opaque practice. This results in millions of ad dollars wasted each year. But it is essential that ad investment works harder in the media mix to obtain optimal reach and effectiveness. As such, our latest research into product category insights provides vital data to help brand owners, agencies and media strategists and planners inform their decision making.”

    In WARC’s latest ‘Global Advertising Trends – Benchmarking ad investment by product category’, the industry intelligence included in the report sheds light on how different sectors value advertising media, and how this has changed over time.

    Key findings for five of the 19 product categories available include: 

    Financial Services

    :: Total global adspend in 2018: $43.2bn (+13.0% year-on-year)

    :: Median revenue ROI for successful campaigns: 2.93

    :: Media spend: Internet $19.7bn (+24.4% year-on-year). TV $12.9bn (+4.0%).

    :: Radio $3.7bn (+5.1%). Other $7.0bn (+6.7%)

    :: Ad/sales ratios: Financial services (3.6%). Banks, credit, loans (6.7%). Insurance (0.8%). Investment (1.5%).


    Close to half of the $43.2bn financial services brands invested in advertising last year was directed towards internet formats. The data show a dramatic shift to digital over the last five years; internet’s share of sector spend has grown 22.0 percentage points (pp) since 2013, to 45.5% last year. This is just above internet’s share of global adspend (44.1%). As a share of sales revenue, the sector spends 3.6% on advertising, rising to 6.7% among banks.


    Food

    :: Total global adspend in 2018: $25.3bn (+1.4% year-on-year)

    :: Median revenue ROI for successful campaigns: 2.93

    :: Media spend: TV $16.5bn (+1.0% year-on-year). Internet $3.7bn (+7.9%). Print $2.8bn (-12.7%). Other $2.3bn (+15.3%)

    :: Ad/sales ratios: Food (2.6%). Confectionery (5.6%). Dairy (0.6%). Meat, fish, poultry (0.7%).


    Almost two-thirds of the $25.3bn in ad investment within the food category last year was spent on TV, nearly double TV’s global share of 33.3%. TV spend in the sector rose 1.0% year-on-year to $16.5bn in 2018 but has dipped by 3.7% each year since 2013 on a compound basis. Print also accounts for a greater share of food adspend than is the case globally, with newspapers’ (-2.6pp) and magazines’ (-2.1pp) share dipping mildly over the last five years.


    Retail

    :: Total global adspend in 2018: $62.3bn (+0.0% year-on-year)

    :: Median revenue ROI for successful campaigns: 4.40

    :: Media spend: Internet $21.5bn (+9.1% year-on-year). TV $20.3bn (-0.6%). Print $9.6bn (-15.5%). Other $10.9bn (+0.8%)

    :: Ad/sales ratios: Retail 2.3%. Clothing & fashion (2.9%). Restaurants (2.0%). Supermarkets (1.2%).


    Global advertising spend in the retail sector was flat in 2018 at $62.3bn. The $1.8bn in extra internet spend (up 9.1% from 2017) was offset by a decline in spend for all other media bar out of home (+12.7%) and cinema (+4.9%). Ad investment among the retail sector has tracked downwards in recent years, recording a compound annual growth rate of -1.8% since 2013. However, online advertising has become far more valuable to the sector during this time.


    Soft drinks

    :: Total global adspend in 2018: $15.1bn (+1.1% year-on-year)

    :: Median revenue ROI for successful campaigns: 2.84

    :: Media spend: TV $10.5bn (+1.1% year-on-year). Internet $1.9bn (+28.3%). OOH $1.3bn (-24.1%). Other $1.4bn (+1.3%)

    :: Ad/sales ratios: Soft drinks (5.9%). Bottled water (5.9%). Carbonated (5.9%).


    At 70.0%, TV’s share of soft drinks brands’ adspend is higher than all other categories studied for the report. The $10.5bn spent on TV ads in 2018 was up 1.1% from 2017

    and has grown at a compound rate of 2.0% each year since 2013 – bucking the global trend. However, investment in other media – chiefly internet – has eroded TV’s share of sector spend by 4.4pp over the five years to 2018. Internet formats still draw a relatively small amount of investment, at 12.8%; this is almost three times less than the global level and is likely a reflection of how little e-commerce has disrupted the sector.


    Toiletries & cosmetics

    :: Total global adspend in 2018: $25.7bn (-3.6% year-on-year)

    :: Median revenue ROI for successful campaigns: 2.06

    :: Media spend: TV $14.9bn (-3.9% year-on-year). Internet $5.6bn (+9.7%). Print $2.9bn (-12.0%). Other $2.3bn (-15.9%)

    :: Ad/sales ratios: Toiletries & costmetics (16.9%). Bath toiletries & soaps (12.3%). Fragrances (21.5%).


    At a top line level, ad investment within the toiletries & cosmetics sector has dipped 4.1% each year since 2013 on a compound basis, to a total of $25.7bn last year. This is largely due to how this spend has been allocated historically: in 2013, TV accounted for two-thirds of adspend while print drew a further fifth. Both of these media have recorded declining spend over the period, with internet (+10.7pp) and out of home (+4.7pp) gaining most in share but from a low base -depressing total investment growth in recent years. Print still accounts for 11.4% of sector spend, with magazines alone worth over $2bn, but this total has more than halved since 2013.


  • Cinema advertising making a strong headway globally, notes WARC report

    By A Correspondent


    The global cinema advertising market is expected to be worth $4.6bn this year, representing a 6.8 per cent rise from 2018. This is ahead of the all-media growth forecast by WARC, of 4.6 per cent for 2019 (to $624.9bn), and places cinema as the second-fastest growing ad medium this year, behind internet as a whole.


    While small, cinema’s 0.7 per cent share of global adspend is expected to hold steady in 2019, making it the only medium other than Internet not to lose share. Figures from WARC’s Adspend Database show that cinema’s share of global adspend has dipped only twice since 1980 (1994 and 2013) and growth in cinema ad investment has generally tracked ahead of other traditional media since 1981, and consistently so since 2014.


    In Europe, advertisers spend 1.6 times more on cinema per admission than in the US. The UK leads the way, with spend per admission rising from £0.18 in 1980 to £1.43 last year, when 177m admissions were recorded – the highest on record. This despite 46% of UK consumers stating that Netflix is their first choice for watching movies, according to GlobalWebIndex.


    The report notes that China is the largest cinema ad market globally, with RMB11.9bn (US$1.8bn) expected to be spent this year. This equates to a 47.3 per cent share of global cinema adspend when measured in Purchasing Power Parity terms. Further, China has accounted for three quarters (74.9 per cent) of global growth in Cinema adspend since 2015, on average, and is expected to contribute 87.4 per cent towards global cinema growth this year.


    In the US, the world’s second-largest cinema market with a projected value of $735m this year, the medium draws less than half a percent of media budgets on average. Seven product categories allocate more than this, most notably food, for which cinema accounts for 1.5 per cent of all media spend.


    Captive audiences viewing high-quality ads in an emotional atmosphere is a draw for advertisers. Research by Ebiquity has found that Cinema outperforms all other media at triggering an emotional response, guaranteeing a safe environment, and getting ads noticed. However, the medium scores lowest in increasing campaign ROI, maximising campaign reach, and generating short-term sales.


    Further, data from the Motion Picture Association of America (MPAA) show that the amount consumers spend on digital home entertainment, including on online subscriptions such as Netflix, surpassed the amount spent at the cinema globally for the first-time last year ($42.6bn versus $41.1bn). This landmark had already been reached in the US during 2015.


    Over the course of an average year, a Netflix subscription will cost a consumer US$113.16. This compares to the $45.55 a North American will spend at the cinema each year on average, with the equivalent figures for the UK and the EU at $25.13 and $11.04 respectively.


    In the US, a moviegoer visited the cinema five times on average in 2018, which roughly equates to 263m consumers going every two months. But with almost three-quarters (74 per cent) of Americans now using an online subscription – and 84 per cent using a pay TV channel – to watch a movie at least 2-3 times each month, viewership in the living room may have reached parity with the silver screen.


    Said James McDonald, Managing Editor, WARC Data, and author of the research: “The experiential nature of cinema places it in a different bracket to SVOD services, which instead occupy a similar space to traditional TV. This, coupled with the exclusivity of box office hits – particularly franchises – should ensure any downward pressure from SVOD services is minimal in the short-term.


    “Cinema offers advertisers access to younger, more affluent audiences who have an affinity with the medium. This enables ads to be screened in a brand safe environment where they will be noticed, often in a location that is close to a retail outlet and, by extension, a point of purchase.”


  • Social advertising growth slows down, notes WARC report

    By A Correspondent


    Marketing services research firm WARC has found that advertising revenues among key social and messaging companies rose 26.2 per cent year-on-year during the first three months of 2019 to reach $17.9bn – the second-highest total on record.


    However, while this growth outpaced all other advertising sectors, it was roughly half the rate of expansion seen just one year earlier (51.6 per cent in Q1 2018). All six companies studied in the report – Facebook, Pinterest, Snap, Twitter, Tencent (WeChat/QQ), Weibo – recorded an easing in ad revenue growth during Q1 2019.


    In North America, the largest market for social advertising ($8.0bn in Q1 2019), user growth has stalled over the last 12 months. Time using social platforms has also stagnated in the region, remaining at two hours per day for the last three years. Facebook has 186m daily users in North America, Snap 80m, and Twitter 28m – numbers that are mostly flat or down from the previous year.


    Further, European user growth across Facebook’s social properties (including WhatsApp and Instagram) slowed to its lowest rate on record (1.4 per cent), while Snap’s users in the region fell for the first time. Daily social media usage fell by four minutes to 1:49 (hours:minutes) across Europe year-on-year, according to GlobalWebIndex.


    Instead, growth is emanating from Asia, in particular from India, Indonesia and the Philippines. Daily social time is also ticking up in the region, reaching 2:11 compared to 2:09 a year earlier. But users here monetise at a far lower rate than their Western counterparts.


    The slowdown in social ad growth comes at the same time as the tech sector in general, and Facebook in particular, is under pressure over its use of consumer data. Recent research by YouGov, Dentsu and Universal McCann, among others, finds that half of consumers believe tech and social media companies have too much power and influence, while a similar proportion feel more industry regulation is required.


    As advertising revenue growth cools, social media companies are increasingly looking to diversify. Facebook has already announced its intention to launch a new cryptocurrency, ‘Libra’, by 2020, with emerging markets being its prime focus, alongside ‘Calibra’, a digital wallet which will be integrated into Messenger and WhatsApp.


    While social shopping is still nascent on Western platforms, in China, the ease of mobile payment has made social shopping a norm. Tencent made RMB21.8bn ($3.2bn) from FinTech in the first three months of this year. But in the US, security and privacy are cited as major concerns for the development of social commerce, and this is a core challenge Facebook will need to confront.


    Summing up, James McDonald, Managing Editor, WARC Data, and author of the research, said: “The social sector is still expanding at a rapid pace – amassing $17.9bn of ad money in the first three months of this year alone – but growth has eased over recent quarters and has halved from a year ago. Further, user growth has stalled in North America and consumer trust in social platforms is waning.


    “Facebook is looking to diversify its revenue streams with the launch of Libra which, the company says, will not be used directly to enrich the consumer data it has harvested for ad selling purposes. However, the cost of advertising on Facebook’s social platforms could feasibly rise if the company proves a relationship between the ads it serves and an increase in Libra-facilitated sales.”


  • Asian Marketing Trends 2017


    By A Correspondent


    WARC, the global body tracking advertising and media effectiveness, has released its annual Asian Strategy Report, an analysis of the region’s most effective marketing trends based on insights from the 2017 WARC Prize for Asian Strategy.


    Said Lucy Aitken, Case Study Editor at WARC: “We’ve analysed the data of close to 200 entries from 17 countries to the 2017 WARC Prize for Asian Strategy to ascertain insights and trends that Asian marketers are deploying to build their strategic capabilities.


    “Against a backdrop of demographic challenges, new technologies and market-orientated reforms, we’re seeing that Asian brands are moving from tactical, activation-based marketing to more long-term, consistent and strategic marketing.”


    WARC’s Asian Strategy Report highlights the following key insights and marketing trends in Asia for 2017:

    Mirroring social change: Purpose continues to be a popular strategy for many brands in Asia that successfully plug into the social and cultural change that is still under way in many territories. Brands are still recognising the long-term value in appealing to women and taking on the issues that are important and significant to them. However, brands need to exercise caution: those that are not entirely authentic to a particular cause will find themselves called out by consumers.


    Low-interest categories, high-interest ideas: User experience is starting to play an important role in brand differentiation, so smart product or packaging ideas are emerging within Asian communications. These ideas are efficient at engaging with elusive target audiences, particularly if they can prove that they are useful products. Asian brands are increasingly putting innovation at the heart of their marketing strategies.


    Channel-first ideas: Channel choice is core to an effective strategy and is not an afterthought. Having a particular target audience and the means by which it is reached, is reframing the brand, building awareness and engagement, and adding to the bottom line.


    Blue Ocean brands: Deploying a Blue Ocean strategy – which sees brands existing in places where they are not competing with rival brands for the same sector – is increasingly important at a time when brands are finding it hard to differentiate through mere function alone.


    WARC Datapoints – Asian Strategy 2017

    • 78% of shortlisted campaigns used online video – a 34% increase from 2016
    • 72% of shortlisted campaigns used emotion – a 41% increase from 2015
    • 2 out of 5 shortlisted campaigns targeted influencers – a 17% increase from 2016


    The Asian Strategy Report 2017 in full is now available to WARC subscribers on warc.com

    The WARC Prize for Asian Strategy is an annual competition showcasing the smartest