
By Indrani Sen
 Hotstar, India’s largest video viewing platform, launched the third edition of its India Watch Report last week. The report is an in-depth study of online video consumption behaviour and trends of Indian viewers on Hotstar and narrates their deep connection with various genres of video content.
As observed by ET Brand Equity on December 11, 2019, “From becoming the favourite destination for cricket lovers on the internet to making Game of Thrones a household name, where viewers in India woke up at 6:30 in the morning to watch episodes of the cult fantasy series, Hotstar has come a long way, and in the process played a critical role in shaping the country’s binge-watching culture.” (https://brandequity.economictimes.indiatimes.com/news/media/hotstar-decodes-the-online-video-consumer-unveils-india-watch-report-2019/72472795)
The report has unveiled quite a few surprising facts, broken a few myths and has highlighted delightful insights through ‘Fun Facts’ under each topic explored in it. Uday Shankar, President, The Walt Disney Company APAC & Chairman of Star and Disney India says in the introduction “Until a few years ago, online entertainment was restricted to the urban affluent. However, we now see newer horizons of customer reach, with non-metro towns driving online consumption. Digital viewership among women has also grown by leaps and bounds. Moreover, Hotstar’s pan-India consumer base reveals how each person has unique and individual choices – men are watching drama and movies from the South are being consumed in the North. While the enchantment of cricket remains unabated, customers are increasingly getting attracted to kabaddi and football. The new Indian consumer is breaking old stereotypes and defying conventional wisdom.”
In 2019, Hotstar saw 555 installs per minute and compared to 2018, the number of installs doubled. Video consumption went up three times compared to 2018. The chart tilted ‘Roti. Kapda. Makaan. Data.’ shows the degree of data consumption by states and surprises us by revealing that West Bengal and Bihar has more data consumption per viewer that Maharashtra and Karnataka. Live viewership of peak consumption of cricket events over 2017, 2018 and 2019 shows it is growing in leaps and bounds.
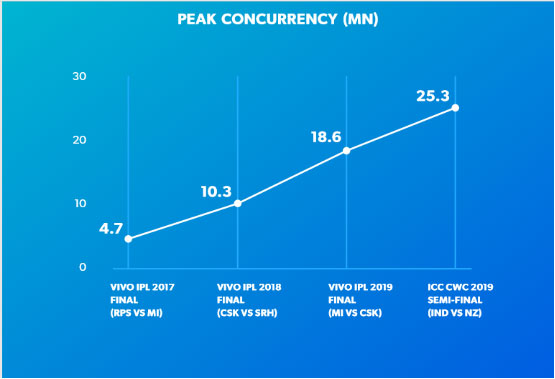
Source: India Watch Report 2019
95% of the video consumption on Hotstar comes from mobiles, which continues to be the primary screen for the users. An analysis of content category split by platform shows that Indians love entertainment, ranging from85% on Connected TV to 58% on Android. Sports are next in a reverse order ranging from 42% on Android to 15% on Connected TV. While most viewers happily switch their smartphone brands, viewers in West Bengal and Kerala have a loyalty to Samsung.
There has been a shift in the demographics of online viewers of entertainment with the share of non-metros going up from 54% in 2018 to 63% in 2019 and Lucknow, Pune and Patna Surpassed Hyderabad, Bengaluru & Kolkata in video consumption. The overall share on women viewers in entertainment grew from 42% in 2018 to 45% in 2019, but overall video consumption by women grew by 3.2 times over last one year. According to the report “More women are owning their right to me-time!”
There has been a huge surge in shopping and food enthusiasts online, particularly over the weekends with these becoming the fastest-growing affinity base on the Internet.
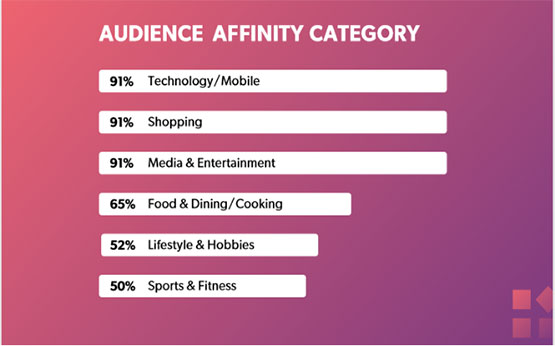
Source: India Watch Report 2019
As reflected by consumption across other media, 40% of total video consumption comes from regional languages with Tamil, Telegu and Bengali leading the list. While 80% of Tamil and Telegu video consumption comes from the native states, only 65% of Bengali comes from West Bengal. In cricket also language and loyalty went hand in hand with 2 times jump in Tamil consumptions during CSK matches, 1.6 times jump in Bengali consumption during KKR matches and 1.5 times jump in Kannada consumption during RCB matches.
The report breaks myth of premium content for exclusive audience by highlighting 40% of Game of Throne viewers and 30% of Koffee with Karan viewers also watch Hindi family dramas. The fact that 40% of viewers of family dramas are men is also surprising as unlike the viewership of the family owned big screen TV, this data is based on individually owned small screen viewership on mobile. An analysis by genres again show men don’t dislike Hindi TV serials and their interest for family and mythological shows is at par with women.
The report presents Leaderboard of TV shows and movies during 2019 highlighting women prefer scripted dramas over reality shows; Hindi movies are a hit with Mumbai showing the highest consumption, while Bengaluru leads the fandom for English movies.
In 2019 online video consumption of news grew by 10 times compared to 2018 with consumption per user growing up 3.5 times. Millennials led the way with 65% of news consumption coming from the age group of 15-34. Delhi consumed the most news in India and surprisingly Lucknow and Patna watched more news than Mumbai.
In sports, Cricket reigned supreme across India and became more interactive in 2019 as Hotstar combined viewing with video games, fandom and food. There is a section ‘Hall of Fames’ giving details of moments that gripped India during cricket matches, Leaderboard of cricket matches as well as most viewed ads during cricket matches. The report shows consumption of both football and kabaddi went up during 2019 but detail analysis shows that football is popular in South India and East India, while Kabaddi is most-watched in Uttar Pradesh and South India.
The report presents a chart showing city wise log off timings. With the ever-growing options for entertainment and other content, sleep has taken a back seat. However, Mumbai, the city that never sleeps is not the last to sleep. Kochi and Gurugram surprise by staying awake more with Hotstar.
Finally, kudos to the Hotstar team for the way they have developed India Watch 2019 as their marketing tool. Apart from enlightening the industry through facts and figures related to viewership on Hotstar, it has showcased case studies of how certain brands achieved their marketing objectives by advertising on Hotstar. In the disguise of a research report on video viewership, the report is an excellent marketing pitch to the advertisers and agencies for choosing Hotstar as their video viewing platform and converting non users of the medium to users.