Tag: India Consumer Sentiment Index

  • 44% view TV News as Most Trusted Source


    By Our Staff


    Axis My India, the leading consumer data intelligence company better know these days for its Exit Poll results, has unveiled its latest report on the India Consumer Sentiment Index (CSI). The survey shows the change in media consumption, particularly among younger demographics, with TV News Channels and Social Media dominating as primary news sources.


    The July 2023 Axis My India CSI survey aimed to understand the primary platform that consumers rely on to stay updated with the latest news. As per the findings, TV News Channels are the primary news source for 44% of respondents, followed by Social Media (23%) and YouTube education/news channels (18%). Newspapers accounted for only 14% of news consumption, while YouTube Shorts had 7%. TV News Channels and Newspapers are preferred majorly by viewers above 60 years while social media platforms and formats are majorly preferred by 18-25YO.


    Commenting on the CSI report, Pradeep Gupta, Chairman & MD, Axis My India, said “Amidst India’s ever-changing economic landscape, our comprehensive survey reveals fascinating patterns in media consumption, information seeking, and online shopping habits. Embracing the digital era, the youth drive a surge in digital platform usage, while traditional sources like TV news maintain steadfast relevance. The cinema’s revival is noteworthy, with urbanites and seniors spearheading this trend. Trust remains paramount, as consumers rely on shopkeepers, local markets, and online searches for product insights. However, data privacy concerns loom, particularly among the younger generation. These insightful trends underscore the imperative for a versatile approach to cater to the diverse preferences of our dynamic consumer base.”


    The survey was carried out via Computer-Aided Telephonic Interviews with a sample size of 5072 people across 35 states and UTs. 67% belonged to rural India, while 33% belonged to urban counterparts. In terms of regional spread, 23% belong to the Northern parts while 22% belong to the Eastern parts of India. Moreover, 26% and 29% belonged to Western and Southern parts of India respectively. 59% of the respondents were male, while 41% were female. In terms of the two majority sample groups, 31% reflect the age group of 36YO to 50YO and 27% reflect the age group 26YO to 35YO.


    Other findings:

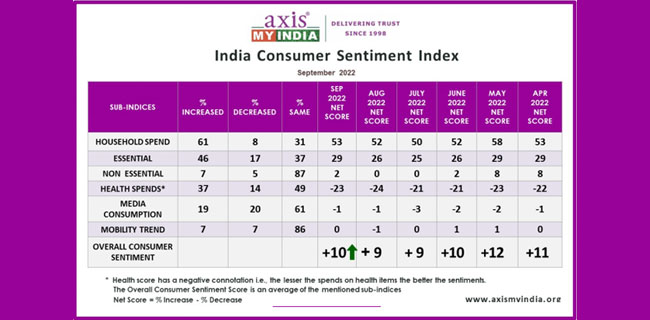
    • Overall household spending has increased for 56% of the families, which is the same as the last two months. The net score, which was +48 last month is +47 this month. The increase is slightly higher in rural households (57%).

    • Spends on essentials like personal care & household items has increased for 31% of the families, which has decreased by 1% from last month. The net score, which was at +20 last month has dipped to +18 this month.Essential spends continue to increase majorly for the rural segment of the consumers (32%) and among 18-25-year-olds (38%).

    • Spends on non-essential & discretionary products like AC, Car, and Refrigerators have increased for 5% of families, which is the same as last two months. The net score is 0, which was same as the last month.

    • Expenses towards health-related items such as vitamins, tests, and healthy food has surged for 30% of families. This reflects a decrease in consumption by 2% from last month. The health score which has a negative connotation i.e., the lesser the spends on health items the better the sentiments, has a net score value -19 this month. Health-related products consumption increased more for the rural segment of the consumers (31%), among females (30%), and among those within the age group of 26-35-year-olds (34%).

    • Consumption of media (TV, Internet, Radio, etc.) has increased for 18% of families, depicting a significant dip in increased media consumption percentage by 6% from last month. This decrease is depicted after an increase was reflected last month at 24% (the highest since April 23) majorly due to IPL. The overall, net score which was at +4 last month is at -4 this month. The increase in Media viewership percentage could be majorly reflected among males (20%) and 18-25 YO (29%) compared to older age groups.

    • Mobility has increased for 8% of the families, which is the same as last month. The overall mobility net indicator score, which was at +2 last month, is at +1 this month. Mobility is highest amongst the age group of 18-25YO at 14% which is 2% more than last month for the same age group.

    • Another key aspect explored was the frequency of movie theatre visits in recent months. The findings reveal interesting patterns in consumer behaviour, where in out of all the respondents, 49% stated that they visited movie theatres once a month, 30% twice, 8% thrice, and 13% more than three times. As a significant proportion of consumers visit movie theatres at least once a month, it could be apt to assume that a consistent interest in cinema as a form of entertainment is again rising back. This keenness is majorly witnessed amongst urban consumers (51%), and females (57%).

    • When seeking information about products they intend to buy, respondents in the Axis My India survey relied on various sources. The primary sources of information were shopkeepers and local markets (36%), followed closely by internet searches (29%), indicating the significance of both traditional and digital channels. A notable 19% of respondents preferred seeking advice from friends, colleagues, or neighbours, highlighting the continued influence of word-of-mouth recommendations in purchase decisions. YouTube emerged as a source of product information for 6% of respondents, demonstrating the growing popularity of video content in informing consumer choices and Television advertisements held relevance for 5% of respondents. Only 2% refer to social media, and 1% go directly to the company website or use print media. While those above 60 years old prefer shopkeepers and local markets, 18-25YO prefer internet searches and YouTube videos. The majority of the 51-60YO prefer seeking advice from others.

    • The survey further unveiled a diverse range of online shopping habits among consumers with a sizable portion yet to adopt e-commerce as their preferred mode of shopping. A significant 64% stated they never shop online. However, 11% do online shopping once a month, and 7% do so once in 6 months to 1 year. Additionally, 6% shopped online once in the last 6 months, and another 6% did so more than once in the last month. Only 3% shopped online more than once in the last 6 months, while a mere 2% engaged in online shopping almost every week. 18-25YO forms the majority segment that shops once a month (19%).

    • The survey further gauged respondents’ sentiments regarding data privacy and security in the context of the increasing usage of the internet and technology in their daily lives. The findings reveal that 45% of respondents reported not being worried about data privacy and security, while 23% expressed a significant concern. Additionally, 26% reported being worried to some extent suggesting a moderate level of concern about data privacy and security. They may have a general awareness of the risks involved but may not be overly alarmed by them. A majority of 18-35YO reflect apprehension to a large extent.

    • Finally, the survey also focussed on farmers’ concerns about the potential repercussions of deficient monsoon on their farming activities in the current year. The findings revealed that 55% of farmers were highly worried, 24% expressed mild concern, 9% were optimistic about a good monsoon, and 13% expected normal monsoons. These findings highlight the apprehensions of a significant portion of farmers, emphasising the importance of addressing agricultural challenges and potential risks associated with monsoon variability.


  • Axis My India releases Consumer Sentiment Index

    By Our Staff


    Axis My India, a leading consumer data intelligence company better known for its exit polls, released its latest findings of the India Consumer Sentiment Index (CSI), a monthly analysis of consumer perception on a wide range of issues. The May report highlights that media viewership has increased for a significant proportion of households, with males and younger age groups displaying higher consumption rates. With the IPL fever gripping the nation, the survey shows that cable/DTH television sets are the favoured mode of watching for the middle-agedd population, while the younger demographic prefers mobile (Jio Cinema). The report also highlights the top brands that captured viewers’ attention, with Dream11 an Thums Up securing the highest recall among viewers. The May net CSI score, calculated by percentage increase minus percentage decrease in sentiment, is at +09, which has increased by 1 point compared to last month.


    The sentiment analysis delves into five relevant sub-indices – Overall household spending, spending on essential and non-essential items, spending on healthcare, media consumption habits, entertainment & tourism trends.


    The survey was carried out via Computer-Aided Telephonic Interviews with a sample size of 10,206 people across 35 states and UTs. 64% belonged to rural India, while 36% belonged to urban counterparts. In terms of regional spread, 26% belong to the Northern parts while 25% belong to the Eastern parts of India. Moreover, 29% and 19% belonged to Western and Southern parts of India respectively. 64% of the respondents were male, while 36% were female. In terms of the two majority sample groups, 32% reflect the age group 36YO to 50YO and 29% reflect the age group of 26YO to 35YO.


    Commenting on the CSI report, Pradeep Gupta, Chairman and MD, Axis My India, said: “Today’s media landscape is evolving at a rapid pace, and our survey results highlight some intriguing trends that businesses and marketers should take note of. From a growing appetite for environmentally conscious products among young consumers, to the increasing popularity of mobile viewing during events like the IPL, to the rising interest in AI tools like ChatGPT, there are plenty of insights here for stakeholders across a range of industries. By paying attention to these shifts in consumer behaviour, businesses can position themselves for success in the months and years ahead.”


  • ‘57% prefer watching IPL on TV, 30% on mobile’


    By Our Staff


    Pause for a moment. Look to the left or right of the screen. Or text in a different colour. This is no marketing initial or promotional exercise done at the behest of one of the competing platforms. It’s the main finding of an Axis My India survey of 10,034 people surveyed, 66% of who are from Rural India while 34% are from Urban India. This is part of the India Consumer Sentiment Index (CSI), a monthly analysis of consumer perception on a wide range of issues. The April report highlights that 19% of families have reported a rise in media consumption. Moreover, the survey reveals that urban areas and male viewers are leading the surge in media viewership. The enthusiasm for IPL is expected to increase further, with both TV & mobile contributing to viewership. The study also delved into the key factors that influence consumers’ buying decisions, revealing that product quality and brand name remain important considerations. Additionally, the survey sheds light on the role of celebrity endorsements in driving product purchases, with younger age groups being more susceptible to their influence.


    The April net CSI score, calculated by percentage increase minus percentage decrease in sentiment, is at +8, which is the same as last month. The corresponding net score last year was +11.


    The sentiment analysis delves into five relevant sub-indices – Overall household spending, spending on essential and non-essential items, spending on healthcare, media consumption habits, entertainment & tourism trends.


    The survey was carried out via Computer-Aided Telephonic Interviews with a sample size of 10,034 people across 33 states and UTs. 66% belonged to rural India, while 34% belonged to urban counterparts. In terms of regional spread, 25% belong to the Northern parts while 26% belong to the Eastern parts of India. Moreover, 28% and 21% belonged to Western and Southern parts of India respectively. 63% of the respondents were male, while 37% were female. In terms of the two majority sample groups, 29% reflect the age group 36YO to 50YO and 29% reflect the age group of 26YO to 35YO.


    Commenting on the CSI report, Pradeep Gupta, Chairman & MD, Axis My India, said: “Closely examining the findings of our latest survey, it is clear that media consumption habits are not uniform across demographics, with variations emerging among different age and gender groups. It is noteworthy that younger age groups are showing a greater appetite for media consumption, with a particular interest in watching the Indian Premier League. Digital is expected to contribute significantly to the rise of IPL viewership. As we delve deeper into consumer behaviour, it is evident that product quality and brand name remain key considerations, but we are also seeing a significant impact of celebrity endorsements on purchasing decisions, especially among younger age groups. These insights highlight the need for brands to stay attuned to the evolving consumer preferences and tailor their marketing strategies accordingly to drive engagement and enhance customer loyalty.”


    On topics of current national interest


    • :: • This month Axis My India’s CSI survey further deep dived to understand citizens’ sentiments towards the 16th edition of Indian Premier League. As per the survey 42% would watch IPL this season, out of this 19% would watch all the matches whereas 22% would only watch matches where their ‘favourite’ teams will play or critical matches like eliminators and finals. About 26% of youngsters (18-25YO) wants to watch all the matches as compared to older age group highlighting their younger spirit and interest in IPL. In addition, male viewers and urban areas show more interest in watching the tournament.

    • :: • Further investigating sentiments, the study discovered that 57% would watch the matches only on cable/DTH Television sets while 30% will watch it only on mobile – Jio Cinema. 8% said they would watch on both TV and mobile. 3% plans to watch the tournament physically from the stadium. About 32% from rural areas show more interest in watching IPL on mobile given the free telecast of IPL matches. Middle age groups, of 26-50 YO would prefer watching more on television than younger age groups.

    • :: • In an attempt to understand product purchase behaviour, the survey found out that 52% considers product quality and 33% considers brand name as important factors. 60% of 18-25YO puts weightage on the product quality whereas 35% of 36-50YO considers brand name as important factors. Price is overall considered as the third most important factor with a vote of only 22%.

    • :: • The survey also unveiled that advertisement in which celebrities feature, influence product buying decisions of 30% to some extent. Of this, about 35% of them are youngsters (of age 18-25) and 27% are middle-old and older age group.

    • :: • With summers approaching, the survey highlighted that overall 15% plans to buy durables like AC or Refrigerators in the next 2-3 months. Moreover 19% of youngsters (18-25 YO), highest amongst all age groups are considering to buy durables like AC, fridge etc. this summer season.

    • :: • The survey also threw light on consumer travel plans this summer season. Overall 24% plans to travel of which 23% said they are planning for a domestic holiday while 1% is planning for an international vacation. Plans of travel is higher in the younger age group of 18-25 years at 30%.

    • :: • On employment opportunities the survey revealed that 50% believe that there are more openings/opportunities as compared to last 10 years. 53% of the female population have a positive outlook regarding the same highlighting the raise in the number of jobs available for the gender. In addition, younger age group (18-25YO) also thinks job opportunities have increased overtime.

    • :: • Moreover, the survey discovered that among the top professions in the country 25% would prefer their children to enrol in the Govt service, 16% would prefer them to be in medical profession while 10% would prefer them to work in fields related to Engineering, Computer application, IT. A majority of 35% are of the view that their children should do whatever they want to do.


    Key findings


    • :: • Overall household spending has increased for 56% of the families, this reflects a decrease of 2% from last month and 6% from April’22. The net score, which was +51 last month and +53 in April’22 has reduced to +49 this month. The two states, which reflected the highest increase, are Telangana with 70%, followed by Andhra Pradesh with 66%. The age group between 26-50 showcased the highest increase (58%).

    • :: • Spends on essentials like personal care & household items has increased for 33% of the families, which reflects a dip by 3% from last month and 15% from April’22. The net score, which was at +23 last month and +29 in April’22, has decreased to +21 this month. Essential spends has increased more for rural segment (33%) as compared to the urban counterparts (31%). Karnataka and Tamil Nadu reflects the highest essential spends with 50% and 49% respectively. The age group between 36-50 showcased the highest increase (36%).

    • :: • Spends on non-essential & discretionary products like AC, Car, and Refrigerator have increased for 4% of families, which is the same as last month and reflects a dip by 9% from April’22. The net score, which was at 0 last month, remains the same.

    • :: • Expenses towards health-related items such as vitamins, tests, healthy food has surged for 32% of the families. This reflects a decrease in consumption by 3% from last month and 6% from April’22. The health score which has a negative connotation i.e., the lesser the spends on health items the better the sentiments, has a net score value -22 this month. Health related products consumption increased more in rural areas (33%) and among age group of 26-35 (about 34%). Karnataka with 49% and Bihar with 43% reflect the highest spends in health-related products.

    • :: • Consumption of media (TV, Internet, Radio etc.) has increased for 19% of the families, which is the same as last month and reflects a dip by 3% from April’22. The overall, net score is at 0 this month. Media viewership has increased more in urban areas (21%) and among males (20%) while it is only 17% among females. In addition, media consumption is more among 18-25 YO which (29%) as compared to older age groups.

    • :: • Mobility has increased for 6% of the families, which reflects a decrease by 1% from last month and same as April’22. The overall mobility net indicator score, which was at 0 last month, is at -1 this month. 10% of the youngsters from the age group of 18-25, has gone out more in the last month as compared to other age groups.


  • 37% spend more than 1 hour on OTT: Axis My India study

    By Our Staff


    Axis My India, a leading consumer data intelligence company, released its latest findings of the India Consumer Sentiment Index (CSI), a monthly analysis of consumer perception on a wide range of issues. The March report highlights that consumption of media such as TV, Internet, Radio has increased for 19% of the families. Moreover, the survey on media consumption reveal a deeper penetration & time spent on OTT platform amongst Indian viewers.


    Commenting on the CSI report, Pradeep Gupta, Chairman & MD, Axis My India, said: “Over-the-top (OTT) consumption has been steadily growing among Indian consumers in recent years, particularly with the increasing availability of affordable high-speed internet connectivity and the widespread adoption of smartphones. The COVID-19 pandemic has also contributed to the growth of OTT consumption in India, with more people spending time at home and seeking entertainment options online. Many OTT platforms have reported a surge in viewership during the pandemic. Overall, the trend towards OTT consumption among Indian consumers is expected to continue in the coming years, driven by the growing demand for digital content, and the convenience of watching content anytime, anywhere, on any device.”


    Key findings on Media Consumption Behaviour

    >> Consumption of media (TV, Internet, Radio etc.) has increased for 19% of the families, which reflects a decrease by 1% from last month. The overall, net score, which was at 0 last month, is at -1 this month


    >> The survey also threw light on the OTT (Over-the-top) viewing behaviour of viewers. According to the survey, 29% spend 1-3hrs watching content on OTT platforms, while 26% spend upto 30 minutes on OTT platforms. 23% watch content for 31mins-1hr and interestingly there are 8% who watch it for more than 3 hours


    >> Moreover, the survey also discovered that 24% share their OTT passwords with their friends & family


    On topics of current national interest:

    >> Axis My India CSI survey deep dived to understand citizens’ sentiments towards the 2023 Union Budget. The survey found out that 52% were pleased with the announcement, which sets out on a quest to fulfil the dreams of the corporates, farmers, and the middle class. However, 29% rated the budget unsatisfactory and only 10% had a neutral stance towards it.


    >> Further investigating sentiments, the study discovered that 72% believe that Indian economy would continue to grow in 2023 in comparison to previous year. The optimism stems from the country’s superior performance in dealing with unprecedented obstacles such as Covid, the Russia-Ukraine war, control of inflation as compared to other nations.


    >> The survey also highlighted that 43% believe that Sensex will go beyond 70,000 in the next three months. Whereas 25% believe that, it will remain between 55,000 to 65,000. Additionally, 18% believe that it will drop below 50,000.


    Key findings on the five indices

    >> Expenses towards health-related items such as vitamins, tests, healthy food has surged for 35% of the families. This reflects an increase in consumption by 2% from last month. The health score which has a negative connotation i.e., the lesser the spends on health items the better the sentiments, has a net score value -24 this month.


    >> Mobility has increased for 7% of the families, which reflects a decrease by 2% from last month. The overall mobility net indicator score, which was at +2 last month, is at zero this month.


    >> Overall household spending has increased for 58% of families, decrease by 1% from last month. The net score, which was +52 last month has decreased by 1 to +51 this month.


    >> Spends on essentials like personal care & household items has increased for 36% of the families, which reflects a dip by 4% from last month. The net score, which was at +29 last month, has decreased by 6 to +23 this month.


    >> Spends on non-essential & discretionary products like AC, Car, and Refrigerator has increased for 4% of families, which reflects a decrease by 1% from last month. The net score, which was at +1 last month, is at zero this month. Sentiment towards discretionary spending has steadily decreased over the last four months.


  • ‘61% watch online video content like YouTube/OTT on their mobile/home TV’


    By Our Staff


    Axis My India, the consumer data intelligence company, has released its latest findings of the India Consumer Sentiment Index (CSI), a monthly analysis of consumer perception on a wide range of issues. The September 2022 report highlights that 20% are planning to shop more this festive season. On media consumption 61% mentioned that they watch online video content either on their mobiles or connected TV. 32% mentioned that they notice advertising on TV, followed by digital (26%). An interesting observation was on app usage, on an average there are 9 apps on the mobile phone of a smartphone user.


    The September net CSI score, calculated by percentage increase minus percentage decrease in sentiment, is at +10, from +9 last month reflecting an increase/decrease by 1 point


    The sentiment analysis delves into five relevant sub-indices – Overall household spending, spending on essential and non-essential items, spending on healthcare, media consumption habits & mobility trends.


    The survey was carried out via Computer-Aided Telephonic Interviews with a sample size of 10014 people across 32 states and UTs. 68% belonged to rural India, while 32% belonged to urban counterparts. In terms of regional spread, 23% belong to the Northern parts while 24% belong to the Eastern parts of India. Moreover 29% and 23% belonged to Western and Southern parts of India respectively. 59% of the respondents were male, while 41% were female. In terms of the two majority sample groups, 32% reflect the age group of 36YO to 50YO, while 31% reflect the age group of 26YO to 35YO.


    Commenting on the CSI report, Pradeep Gupta, Chairman & MD, Axis My India, said “After compromising past two festive seasons to the pandemic and its related constraints, this year consumers are expected to shop more during festivities. One can witness slight increase in expenses across essential and discretionary products already. Further improvement in mobility sentiments highlights the fact that more and more people are enjoying the stores and malls experience of discovering, shopping and gifting. This sentiment is also extended among the Indian farmers, wherein a significant percentage of 15% intends to buy a brand new tractor in the next one year. This is thus a crucial time for the Indian advertising business as spend are expected to bring a lot more returns than usual. As more and more people (61%) are watching online video content (YouTube/OTT) on their mobile/home TV and thereby noticing ads across TV, online and social media platforms, it is of utmost importance for the media industry to tap the right medium for addressing differentiated consumer needs.


    Key findings:

    • Overall household spending has increased for 61% of families which is the same as last month. The net score which was +52 last month has increased by +1 to +53 this month

    • Consumption of media remains the same as last month, which is 19%. The overall, net score, which is -1, this month, also remains the same

    • Mobility has increased for 7% of the families, reflecting an increase of 1% from last month.

    • Spends on essentials like personal care & household items has increased for 46% of the families which is an increase by 1% from last month. The net score which was at +26 this month has increased by +3 to +29

    • Spends on non-essential & discretionary products like AC, Car, and Refrigerator has increased for 7% of families which reflects an increase by 1% from last month. The net score which was at 0 last month has improved to +2 this month. This could reflect the spirit of festive season approaching.

    • Consumption of health-related items has increased for 37% of the families, which reflects a decrease by 1% from last month. The health score which has a negative connotation i.e., the lesser the spends on health items the better the sentiments, has a net score value of -23, as compared to -24 last month.


    On topics of current national interest:

    • In an attempt to understand consumer’s engagements with mobile apps, the survey discovered that on an average consumers have 9 apps on their smartphones. 16% use minimum of 4-8 apps, through their smartphone and 22% have more than 8 apps. A significant 24% mentioned that they use a feature phone

    • In order to understand in which medium advertisements get noticed more, the survey found out that a majority of 32% notice advertisements on TV, while 26% notice it through online mediums. It also discovered that only 17% notice ads on social media platforms, 15% on Print, 6% on Outdoors and 2% on Radio.

    • The survey further revealed that a majority of 61% watch online video content like YouTube/OTT on their mobile/home TV.

    • Digging deeper into the festive spirit, the survey shows that 20% plan to shop more this festive season compared to last year. However 32% plan to shop the same as last year

    • According to Axis My India Consumer Sentiment Index Survey, 48% of consumers shop/purchase more products during the festive season as compared to rest of the year

    • Exploring farmer’s sentiments towards new tractors, the survey found out that 10% are planning to purchase new tractors in the coming year, while 3% and 2% plan to but within 6 months and 3 months respectively. Also, a significant 86% of farmers don’t own a tractor, because of reasons like smaller land size, renting or affordability.


  • 57% consider brand’s rep while purchasing: Axis My India survey

    By Our Staff


    Axis My India, the leading consumer data insights firm, released the latest findings of the India Consumer Sentiment Index (CSI), a monthly analysis of consumer perception on a wide range of issues. The July 2022 report highlights that 25% of Indians watched IPL this year, which means a significant 75% didn’t watch IPL. The survey further discovered that 65% have watched IPL through television and 29% through digital platforms. These numbers gain significant importance given the unprecedented valuation at which the IPL media rights were recently sold.


    The July net CSI score, calculated by percentage increase minus percentage decrease in sentiment, is at +9, from +10 last month reflecting a very minor decrease by 1 point. The sentiment analysis delves into five relevant sub-indices – Overall household spending, spending on essential and non-essential items, spending on healthcare, media consumption habits & mobility trends.


    Commenting on the CSI report, Pradeep Gupta, Chairman & MD, Axis My India, said, “Overtime, consumer spending has reached a status quo bias where the keenness to increase consumption has been limited. This is mainly due to inflation and the after effects of pandemic which has made it difficult for consumers to see their nominal incomes recover to pre-pandemic levels. While in response to this the government has reduced the petrol and diesel prices, a major chunk of consumers are still looking for further ease. Similarly in media, one can witness respondents suffering from consumption fatigue which could be related to innumerable choice of content, ease in mobility and the availability of experiencing ‘cinema’ etc. The craze around IPL persists across platforms but whether this excitement justifies its high media rights, time will tell. Digital viewership is on a high trajectory. In terms of consumption behaviour, a significant proportion of consumers are increasingly taking their purchase decision basis reputation of the brand with price as the second key factor, which shows the growing maturity of Indian consumers.


  • Media consumption up for 22% of families: Axis My India

    By Our Staff


    Axis My India, the consumer data intelligence company better known for its exit polls (coming soon!), released its latest findings of the India Consumer Sentiment Index (CSI), a monthly analysis of consumer perception on a wide range of issues. The month of February encapsulates that while almost 46% views ads on the internet, only a little more than half of it shops online with the most preferred apps being Flipkart, Amazon and Meesho. In addition, while this month’s media consumption has increased for 22% of the families, a second majority of 29% reveal that online TV streaming services have changed the way one watches television.


    Commenting on the CSI report, Pradeep Gupta, CMD, Axis My India, said: “With greater relaxation from the government in terms of mobility and increased encouragement from corporates to return to physical setting, we can witness the country’s effort to go back to the ‘old normal’. Consumers are spending where necessary and exercising ‘very mild’ caution on discretionary expenditures or mobility habits. Attracting consumers’ interest is also the five state elections, as they are expected to have an overall impact on the country’s economy. In addition, positive outlook towards RBI’s proposed digital currency also reflect the nations wider acceptance towards this change. PM Narendra Modi being voted as the leader best suited to guide India’s internal & external security in the wake of the current Russia-Ukraine crisis is not a surprise. Finally, increased online ad consumption & online purchase behaviour reflect the gradual dominance of digital in a consumer’s life and the need for marketers to develop an omni-channel marketing strategy.”


    Key findings:

    • Consumption of media has increased for 22% of the families reflecting an decrease of 2% from the last month. Consumption remains the same for a majority of 57% of families same as last month. The overall, net score of this month is at +1 as compared to +2 for the previous month

    • Overall household spending has increased for 54% of families which reflects a 1% increase from the last month. The net score which was at +39 last month has increased by +5 to +44 this month.

    • Spends on essentials like personal care & household items has increased for 43% of the families which has maintained compared to last month. Spends however remain the same for 38% of the families. The net score which was +20 last month has increased to +24.

    • Spends on non-essential and discretionary products like AC, Car, Refrigerator has increased for 8% of families. Expenditure nevertheless remains the same for 87% of the families. The net score is at to +3 remaining the same as last month.

    • Consumption on health-related items more or less remains the same for 49% of the families, while a surge is witnessed among 35%. The health score which has a negative connotation i.e., the lesser the spends on health items the better the sentiments, has a net score value of -19 as compared to -20 last month. This signifies persisted apprehension for overall health and well-being of the consumers.

    • 90% families said that they are going out the same for short vacations, mall and restaurant. Increased travel is reflected only among 5% of families while 5% reported reduced mobility. The overall mobility score which was at -3 last month has remained the same.

    On topics of current national interest:

    • Axis My India further evaluated consumer’s views on the impact of streaming services on television viewing. A majority of 57% said that online streaming services has not impacted their television viewing habits, signifying that TV is still the dominant medium in India. 29% however is of the view that online TV streaming services have changed the way one watches television, this insight unravels a surging need for video on demand services that provides flexibility in content viewing

    • To gauge advertisement attention in the mind space of consumers, the survey discovered that a huge 46% notice ads on internet. This behaviour is higher in the younger age groups as expected.

    • Assessing consumer’s views on online shopping preferences, Axis My India’s survey found out that only 29% indulge in online shopping. In addition a majority of 46% prefer to shop via Flipkart, while 33% prefer to shop from Amazon. Meesho, Myntra, Snapdeal, Ajio and Paytm Mall are other preferred choices.

    • The CSI – Survey furthermore captured consumer’s views on upcoming five state elections of Uttar Pradesh, Punjab, Uttarakhand, Manipur and Goa. A huge majority of 50% strongly believe that the results of these 5 state elections will have a considerable impact on the 2024 National Elections. These are the views of people residing across the nation & not just the election states.

    • In an attempt to understand consumers view on a series of Budget announcement, Axis My India discovered that 68% believe that RBI’s proposed Digital currency/Digital Rupee will encourage safer and secure mode of online transaction/ transfer of funds. This positive outlook could mean a wider acceptance of the proposed digital currency upon its introduction. A minority of 13% and 6% believes that the digital rupee will ensure reduced dependency on cash/physical notes; and stimulate increased global as well as rural transaction respectively.

    • Exploring consumer’s views on the start-up ecosystem, the survey discovered that 85% believes that start-ups are going to be the backbone of ‘New India’.

    • Finally, 41% of respondents believe that PM Narendra Modi is best suited to handle India’s internal & external security, a factor which gains prominence considering the current Russia-Ukraine crisis.


    INDIA CONSUMER SENTIMENT SCORE

    * Health score has a negative connotation i.e., the lesser the spends on health items the better the sentiments.

    * The Overall Consumer Sentiment Score is an average of the mentioned sub-indices


  • Axis My India CSI Survey: Most impactful celebrity of 2021

    By Our Staff

    Axis My India, the consumer data intelligence company better known for its exit polls, released its latest findings of the India Consumer Sentiment Index (CSI), a monthly analysis of consumer perception on a wide range of issues. The month of December reveals Prime Minister, Narendra Modi as the most impactful celebrity of the year – view of 40% across India (majority). Chief Minister’s of Uttar Pradesh- Yogi Adityanath, Tamil Nadu- M K Stalin and West Bengal- Mamata Banerjee followed suit along with Indian Cricket captains Virat Kohli, Rohit Sharma and former captain MS Dhoni.

    Commenting on the December report, Pradeep Gupta, CMD, Axis My India, said: “The survey finds that PM Modi is overwhelmingly popular across the country and the most recognisable face in India. 40% of the total people surveyed have picked him, far higher than any other personality on the list. Virat Kohli stood second at 4% followed by Yogi Adityanath at 3%. Mr. Modi’s popularity seems to be growing at a time when world leaders are facing dwindling popularity. This poll is yet another demonstration of Mr. Modi’s grasp over the pulse of the nation.”


  • OTT penetration stands at 27%- Axis My India, CSI Survey

    By Our Staff


    Axis My India, consumer data intelligence company, released its latest findings of the India Consumer Sentiment Index (CSI), a monthly analysis of consumer perception on a wide range of issues. The month of November reveals same media consumption for the majority of the families as last month. Consumer’s online behaviour further reflect a preference of Indian languages over others. Among top OTT platforms Hotstar, Amazon Prime, Netflix, Jio TV and MX Player were among the top choices.


    The December net CSI score, calculated by percentage increase minus percentage decrease in sentiment, was down to +8, from +9 last month and first time slight dip in the net score is observed since past 4 months, a reflection of the post-festive period sentiment.


    The sentiment analysis delves into five relevant sub-indices – Overall household spending, spending on essential and non-essential items, spending on healthcare, media consumption habits & mobility trends.


    This month, Axis My India’s Sentiment Index also delved deeper to understand consumer’s consumption in the digital ecosystem in terms of OTT platforms, language preferences. Consumer sentiment was also tracked to understand their expenses in terms of discretionary products and investment preferences. In addition, the survey tracked consumer’s opinion on India’s performance in the T20 Word Cup.


    The surveys were carried out via Computer Aided Telephonic Interviews with a sample size of 10552 people across 36 states. 64% belonged from Rural India while 36% belonged from urban counterparts.


    Commenting on the November report, Pradeep Gupta, CMD, Axis My India, said: “With the year approaching to an end, we witness consumer’s gradual return to normalcy though a slight drop in Net Promoter Score also demonstrates that the impact of festive spending is slowly tapering. While media consumptions remain standard for majority, our CSI Survey has further revealed that consumers from the north as well as the south favour vernacular languages when engaging with the digital mediums. This insight opens up opportunities for various local as well as national and international players in terms of where and in which form to place their brand content and advertisements.  Moreover it is interesting to note that in spite of a plethora of new age tech firms coming up with IPOs, Indian consumers still prefer to park their confidence in established companies and Government owned stocks and shares, providing a contrarian approach to the FOMO investing theory”


    Key findings:

    Overall household spending has increased for 62% of families which reflects a 1% decrease from the last month. This increase is majorly reflected in the northern part of India


    The increase in spends on essentials like personal care and household items stands at 49% showcasing a surge in the north and south of India. The net score which was +27 last month remains the same for this month. Percentage of families whose consumption remain same as last month has increased by 2% from last month.


    Spends on non-essential and discretionary products like AC, Car, Refrigerator has increased for 15% of families. While the increase in non-essential spends has decreased by an overall 3% from last month. The net score therefore which was at +9 last month has reduced to +6. The increase in spends is however identified in north and eastern part of India.


    Consumption on health-related items has increased for 42% of families which overall represents the lowest percentage in the last three months. The health score which has a negative connotation i.e., the lesser the spends on health items the better the sentiments, has a net score value of -25.


    Consumption of media remains the same for a majority of 52% families which reflects the highest percentage since the last four months and is majorly from the south of India. Consumption has increased for 22% of the family, majorly from east and north, majorly amongst 18YO-25YO and 26YO-35YO. Overall, the Net score of this month is at -4 as compared to -2 for the previous month.


    81% families said that they are going out the same for short vacations, mall and restaurants as compared to last month. This represents a steady increase in movement from 78% in August to 3% increase in November. Increase in movement is majorly seen in the south of India and the least in the North. Increase in mobility is further seen concentrated among the 18YO-25YO. The overall mobility score is at -5.


    On topics of current national interest:

    Axis My India further gauged consumer’s sentiment on their digital behaviour. A combined 27% said that they prefer engaging with websites and mobile applications in Hindi and other regional languages while 24% preferred English. Moreover it was identified that 31% of the population that resides in the southern part of India prefers using apps and websites in the English language, whereas 27% in the northern belt prefers engaging with Hindi based apps and networks. In addition, regional language based apps and sites reflected the choice of southern India at 34%. In addition it was discovered that majority of the youngsters (60%) amongst 18-25 prefer digital interactions in English, whereas those above 51 prefer Hindi and other regional languages.


    When asked if they spend time watching content on OTT or video streaming platforms, only 27% said yes whereas 73% reflected their view otherwise demonstrating the scope of penetration. Majority of the viewers are of the age of 18-35. Of the people who prefer OTT content, a majority directed their choice towards Hotstar followed by Amazon Prime and Netflix.


    In terms of investment choices in stock and shares, 17% and 12% showcased their preference towards Private Companies and Government owned respectively. Only 1% said they preferred to invest in IPOs, contrary to the euphoria around new generation IPO’s


    Capturing consumer indulgence, Axis My India survey showcased that only 7% bought discretionary product this month like AC, TV, Fridge etc. Out of which 34% further claimed to have bought a 2-Wheeler, whereas a mighty 21%, 18% and 9% have spent on Television, Fridge and Car respectively.


    Gauging views around Team India’s average performance in T20 World Cup 2021, the survey further discovered that out of those who have watched ICC T20 WC, 48% believe that it is due to the team selection while 23% believe it was a result of player fatigue.


  • 42% families to spend more or same in festive season…


    By Our Staff


    Axis My India, the  consumer data intelligence company better known for its exit poll results, has released its August 2021 findings of the India Consumer Sentiment Index, a monthly analysis of consumer perception on a wide range of issues. Given that it’s August, and pre-festive season, we thought it would be appropriate to highlight it.


    The net CSI score, calculated by subtracting the percentage increase from the percentage decrease in sentiment, was recorded at +6, rising at the fastest pace over the last month, indicative of a positive shift in consumer consumption metrics.


    The sentiment analysis delves into five relevant sub-indices – Overall household spending, spending on essential and non-essential items, spending on healthcare, media consumption habits & mobility trends.


    The surveys was carried out via Computer Aided Telephonic Interviews with a sample size of 10,482 people. As many as 72 per cent of the people surveyed were male and 28 per cent female. The respondents were from 28 states and seven Union Territories.


    Commenting on the August report, Pradeep Gupta, CMD, Axis My India, said, “As the festive season approaches, consumers are slowly stepping out – as proven by increased numbers for non-essential spending and mobility. This should have a positive effect on the hospitality industry which has been severely affected due to the pandemic. Tourism, however, continues to be a concern as 83% of the respondents are still averse to travelling.  Economic sentiment is looking buoyant with ~64% of the respondents expecting the Sensex to cross 60,000 before the end of this year. Along with the nation-wide vaccination drive, over 96% respondents pledging to adhere to all covid protocols, it is hoped that there will not be a surge in cases post the festive season. A net positive score of an additional 5.5 points over the last month indicates a steady progress towards social and economic normalcy, with this trend expected to improve further in the next few months. Overall, we hold a cautious but optimistic outlook on consumer sentiments. By plugging into economically and culturally significant data-points, the CSI will try to gauge, interpret, and predict the impact of macro factors on the lives of the average India across demography & geographies. Our mission is to bring out the most authentic voices via the rigour of data and analytics”


    Key findings:

     • Overall household spending has increased for 56% of the families which is an increase of 2 percentage points, the same figure being 54% last month. Increase is highest in North India at 61%. The net score is at +42.

    • The spends increase on essentials like personal & household care is at 47%, an increase of 4 percentage point over last month. The net score is +21.

    • Spends on non-essential & discretionary products is still cautious with 21% families mentioning an increase but which is still a growth as the same figure was 15% in July. This shows the festive spirit slowing building up with the net score having increased to +9 from -12 last month. Interestingly, the sentiment increase is highest in Rural India.

    • Health still remains an important consideration, with consumption on health-related items has increased or remained same for 79% of families and decreased only for 21% families. The health score which has a negative connotation i.e. the lesser the spends on health items the better the sentiments, has a net score value of -24.

    • Consumption of media has increased for 25% families & remained same for 47%. The corresponding increase figure was 28% last month. Net score is at -3. The media consumption increase is highest in the 18-25 year old age group at 32%.

    • In terms of mobility 93% families saying they are going out the same or less on short vacations/mall/restaurants, with the overall mobility score is at -8 which is an improvement over last month which was at -24.


    On topics of current national interest:

    • When asked will you shop more or less this festive season, 42% of families said they will shop more or same as compared to last year. This gives an indication that there is sense of cautious optimism and the pent-up demand or degree of revenge shopping which happened last year might not be the same this year. This expected increase in spends is higher among private & government service employees.

    • 88% of the office going individuals were happy that offices are starting to open and felt that productivity is better from office.

    • 83% are not yet looking at a travel/holiday this year and 15% mentioned they would only travel domestically.

    • Showing a sign of self-maturity, 96% people said they will implement Covid appropriate behaviour this festive and hopefully this will reduce the level of cases in case the 3rd wave strikes.

    • On current euphoria around the Sensex, of those who invest, 64% believe that the BSE Sensex will cross the mark of 60,000 in the next few months with 29% saying it will come down. Additionally, in a true reflection of Indian investor population there is still a vast majority of 74% who don’t invest yet in stock market.

  • Axis My India publishes India Consumer Sentiment Index

    By Our Staff


    Axis My India, a leading consumer data intelligence company though better known for its Exit Poll results, has published the India Consumer Sentiment Index (CSI), a trend analysis that will track real-time shifts in consumer sentiment nationally. The sentiment analysis delved into five relevant sub-indices – Overall household spending, spending on essential and non-essential items, spending on healthcare, media consumption habits and mobility trends.


    Commenting on the launch of the report, Pradeep Gupta, CMD, Axis My India, said: “The India Consumer Sentiment Index is our endeavour to capture the shifts in the pulse of the demographic as we navigate a radically altered post-pandemic world. We have selected relevant categories like inflation in household spends and expenditure on healthcare to account for everyday challenges affecting a significant percentage of the population. While the second wave negatively impacted economic sentiment around employment and business prospects, the index will aspire to demonstrate the accurate picture based on the remodelling of the vaccine distribution strategy, which has shown encouraging results. By plugging into economically and culturally significant data-points, the CSI will try to gauge, interpret, and predict the impact of macro factors on the lives of the average India across demography and geographies. Our mission is to bring out the most authentic voices via the rigour of data and analytics.”