Published from the GroupM TYNY Report
Globally, we estimate that television ad revenue declined by -3.6% in 2019, excluding U.S. political advertising (or -5.5% including it).
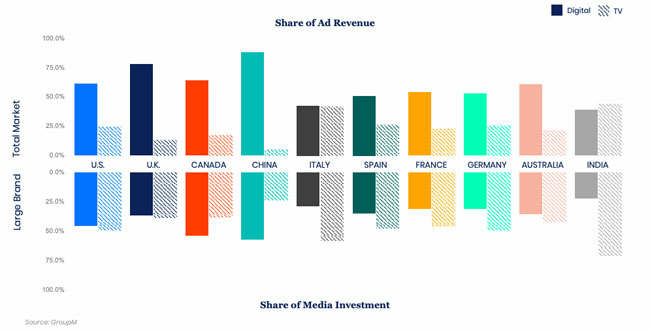
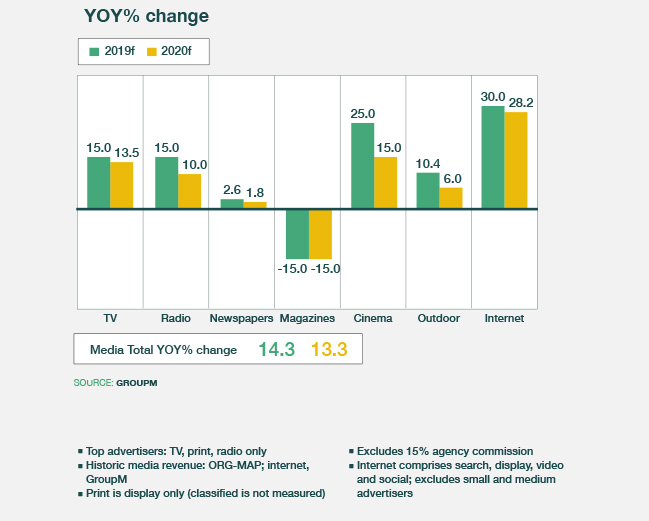
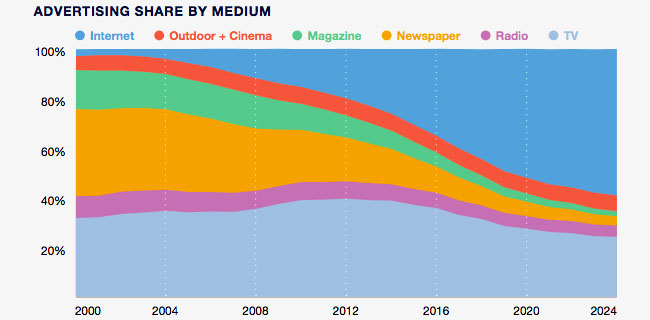
Despite the inclusion of digital extensions associated with TV in some markets (including the U.S. and U.K.) and various other advancements, TV is unlikely to grow in the future on an underlying basis, and we expect just under $170 billion in annual ad revenue each year through 2024. New forms of TV—or premium video advertising— will likely lead to a shift in spending within the medium going forward. Although television arguably remains most effective in helping marketers build their brands, the relative effectiveness of television has likely fallen, at least incrementally. And, the share of budgets allocated toward TV have generally diminished incrementally with each passing year. This has occurred as some advertisers shifted some budgets out of TV and into digital, and other advertisers shrank in size and reduced media spending, including TV. Television now commonly represents around 40% of a typical large brand’s media budget, or 27% on average across all advertisers as reflected here for 2020. Interestingly, the median growth rate in 2019 was +0.1% and should be +1.8% in 2020, illustrating that there are many countries where TV advertising is still growing. The median country should see growth of between +1–2% each year through 2024.
Top of mind for many marketers using television as a key part of their media mix is the impact of new SVOD services, especially the U.S.-based media giants. In a mature market such as the U.S., we can see the impact of the availability of streaming alternatives prior to the launch of Disney+: Cord-cutting and cord-shaving are accelerating to record levels, with total Pay TV subscribers now falling annually by low single digits, and the median network losing mid-single-digit percentages of subscribers on a similar basis.
Traditional TV viewing across all audiences and all forms is down only slightly, but this masks the growth of streaming-related activity. Concurrently, consumption of television using internet-connected devices accounts for nearly 15% of TV-related activity, and is growing by around +30% year over year. A majority of this internet-connected-device viewing is directed to SVOD services.
The leading driver of this behaviour is Netflix, of course, with 158 million subscribers in total, including approximately 61 million U.S. subscribers (50% of all U.S. TV households), 12 million in the U.K. (41% of all households there), 10 million in Brazil (close to 20%), six million in France (nearly 25%), and six million in Canada (nearly half). The competitive offering from Amazon’s Prime Video is nearly as widely subscribed, while other services primarily operating in single countries—including Baidu’s iQiyi, Alibaba’s Youku Tudou, and Tencent Video (all in China); Hotstar and Hulu (in India and the U.S., respectively, and both owned by Disney)—have also emerged. In addition, a growing range of specialist and niche services and streaming replacements for traditional TV networks is now widely available. And of course, much more is set to come in the year ahead following the 2019 launch of Disney+ and Apple TV, with pending launches of new services from Comcast/ NBCUniversal’s Peacock and AT&T/WarnerMedia’s HBO Max.
For these new SVOD services to have a meaningful impact in the U.S. or elsewhere, meaningful investments will still be required—and the media owners making those investments will face hard financial choices. Some of the new SVOD services are launched by traditional TV owners, and accelerating investment in SVOD content will partially depend on overcoming the friction tied to cannibalising existing revenue streams. These are hard decisions. Taking risks and making investments will help futureproof their businesses, but not every company will do all they need to in the short term in order to ensure long-term health.
Consider the scale of investment required to be competitive:
- In the U.S. alone, Netflix is on track to spend around $3.5 billion this year on an accrual basis, or probably closer to $5 billion in cash terms (assuming one-third of the global $15 billion in expected spending this year is attributable to the U.S.). This amounts to around 5% of the ~$75–80 billion spent by all MVPDs and streaming services in the U.S. This spending is arguably reasonable, considering how much viewing Netflix generates: The company accounts for 37% of all streaming consumption on televisions in the U.S., and streaming accounts for around 14% of TV consumption, according to Nielsen data. From this data we can calculate that Netflix has a 5% share of viewing, roughly the same as their percentage of spending on content. Over the next several years, costs will undoubtedly rise as Netflix looks to maintain its audience share, and so it is not unreasonable to think in terms of $5 billion in spending on an accrual basis (or more than $6 billion on a cash basis) by 2024.
- Disney expects to spend $5 billion annually on content for Disney+ by 2024, with one-third of subscribers inside the U.S., and presumably a proportional amount of spending on content assigned to their U.S. content expenses. This will be paired with spending on Hulu, which last year amounted to around $2.5 billion, and which will presumably rise significantly. Even backing out costs associated with Hulu’s vMVPD service, we could expect a $4+ billion streaming content bill for Disney’s domestic operations in 2024.
- Similarly, AT&T has indicated that by 2024 it will be spending an incremental $3 billion on domestic programming for its HBO Max service, above and beyond what it already spends on HBO today.
- According to the Financial Times, Apple has committed $6 billion to spending on original shows and movies for its TV service, presumably globally, over an unclear time horizon.
If each of these services aims for viewing parity, it is not hard to imagine their spending $4 billion per year, on average. Additional services will also undoubtedly be significant buyers of content, including Comcast’s Peacock and ViacomCBS, which will presumably invest more heavily in their initiatives as the two companies formally come together. The total amount of annual spending in the U.S. alone would likely amount to around $30 billion if all of this plays out.
All of this new spending would be consistent with recent increases in industry-wide programming costs. If the non-streaming world were able to hold the line on its content spending at around $70 billion, the $30 billion referenced above would represent an incremental $20 billion on spending (as streaming services currently spend around $10 billion on content annually). Over the next five years, this would equate to a roughly +5% increase in annual spending on programming by the services consumers receive in the U.S., a lower figure than the +7% increase in spending on programming we saw from cable and satellite operators over the past five years between 2013 and 2018.
However, the economics of streaming services are very different than those of the traditional MVPD business. They are less favorable on a stand-alone basis and usually need to be considered in the context of other services with which they are bundled. Assuming that advertising attributable to streaming services will not be incremental to the industry, direct revenues probably won’t fully offset costs by much, if at all, leading to margin erosion.
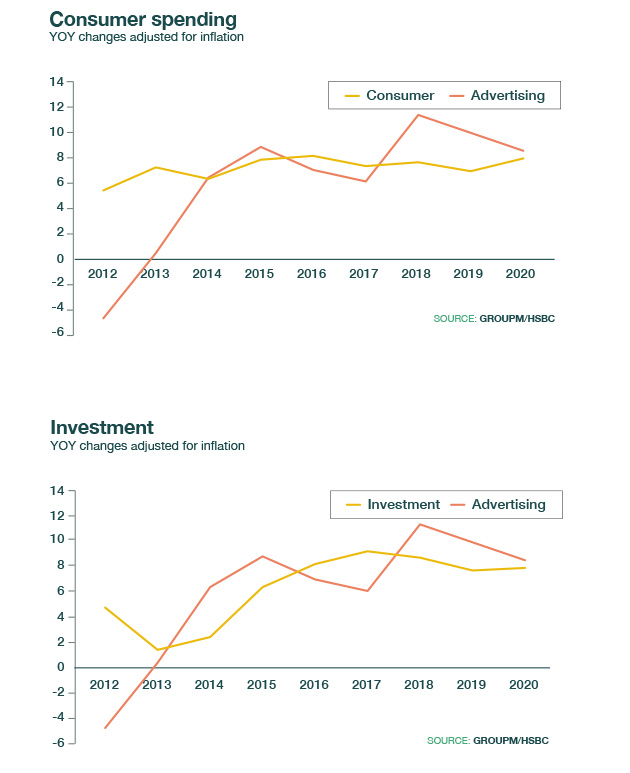
There will only be so much money to go around for subscription fees. If consumers continue to increase their spending on all forms of video (which amounted to $140 billion last year for video services, cinema and DVDs) at historical rates through 2024, there will only be an incremental $20 billion in consumer spending available for new services. This is roughly equal to the amount of new spending on content that we estimate above. And, unfortunately, advertising is not likely to be incremental for the industry (as there is only a limited relationship between changes in supply or improvements in targeting and changes in total spending in the advertising industry, unless new advertiser segments are brought into the medium). This suggests that financial contributions from these new services will not be net positive anytime soon.
Favourably for Disney, Comcast, AT&T and Netflix, at least, what money is available will mostly go to these companies, as Amazon and Apple appear to primarily look at streaming services as a value-added product and are not likely to attempt to recoup all of their costs directly. The overall economics of these services can be viewed more favorably if we consider their contribution to other business, including reduced churn or pricing premia for services with which they are bundled.
For the media industry, the question is what media owners’ tolerance for margin erosion will be. This will drive the pace of change in the years ahead. Some owners of streaming services will be more tolerant than others and position themselves more favourably for the future. But it’s also possible that every one of them agrees that this kind of business reinvention ultimately leads to better business in the long run. For consumers, this world arguably looks quite favorable as it offers up better-quality content with the opportunity to purchase content packages more granularly, as needed, even if costs per hour of content purchased rises. For advertisers, some elements of television will worsen because ad inventory is likely scarcer, and reach is likely harder to come by. On the other hand, where advertising does exist in this new world—and many streaming services will embrace advertising as an element of their financial models—it will likely reach more engaged consumers, in potentially more valuable environments than those that have come before.
Toward these ends, many advertisers want to prepare for such an eventuality. For those who believe it is prudent to make such plans, what should advertisers do? It bears repeating that ad-supported TV in its broadest definition—including streaming equivalents—remains strong in absolute terms and generally maintains superior reach relative to alternatives for most audiences. Of course, there are significant challenges to be overcome in managing campaigns optimised for reach and frequency, given the manner in which those campaigns must be run across different sellers of advertising and different devices, and given the limitations of existing measurement systems.
If ad-supported TV declines relative to alternatives, different approaches to media planning may be considered. Beyond premium video, many advertisers may run video across environments that include other digital content or on digital out-of-home in an effort to sustain broad reach, albeit without the borrowing of content’s brand equity. Another alternative includes optimizing reach across a wider range of media, with a focus on using each medium to drive awareness as best as each can. Other marketers might find that a focus on outcomes as opposed to proxies for long-term outcomes (which brand awareness is arguably best at) rather than reach is a preferred approach.
A future with less premium video advertising should present an opportunity to take a fresh look at how marketing is budgeted. If the insights and ideas supporting brands will be more impactful than any individual media execution, processes should focus more on investing in those insights and ideas. Investing in a broader notion of a consumer’s potential life cycle with a brand—ranging from brand ideas to media exposures, brand experiences and word of mouth (including all of the data and marketing technologies that support them)—will probably be impactful as well.
We are mindful that U.S. trends may occur in other countries, but probably not everywhere—at least not in the same ways over similar periods of time. We see cord-cutting in some other countries, like Brazil, where we see mid- to high-single-digit annual declines in pay-TV subscribers. However, in many other places, the concept of cord-cutting is not meaningful yet, especially in countries where digital terrestrial TV makes it possible for consumers to access what Americans might think of as “basic cable” with a simple antenna, or through a free set-top box provided by an internet service provider. Viewing trends will also be impacted by the fact that pay-TV penetration has often been low to begin with in many countries. This would limit the hours consumers have historically spent with TV, at least relative to the U.S. Where that has been true, it is possible that the wider availability of SVOD services (and the premium content they offer) could lead to an expansion in viewing of the medium in its broader definition. More viewing, especially of high-quality TV content, should lead to more engaged viewers—all things being equal—and should prove to be positive for advertisers.
TOMORROW: THE YEAR AHEAD FOR THE INTERNET